Choose Your Own Adventure: SRE Life at Red Hat

Red Hat does managed services. We do DevOps in the style of the Google SRE Book. We’re a decent sized and growing org that supports customers 24/7.  Our team is at the forefront of operationalizing OpenShift 4’s revolutionary set of capabilities, and are a way-to-market for many of Red Hat’s newest portfolio offerings.

What does a day-in-the-life of a Red Hat SRE look like…  You remember these, don’t you?

unnamed

If you drop into one of our Slack channels, you might find some interesting discussions on

  • Building and maintaining CI/CD pipelines.
  • Writing Operators in golang to handle managed services use-cases.
  • Handling upgrades of managed OpenShift clusters.
  • Chatting with cloud provider technical teams on weird quirks of their API.
  • Debugging bizarre, nearly intractable production issues using the scientific method.
  • Ensuring our managed OpenShift platforms are the most secure offerings possible.
  • Patternfly-based front-end work:  https://cloud.redhat.com/openshift
  • We should probably write a library that lets teams version control their SLI/SLO/SLAs and generate Grafana dashboards from them.
    • Prometheus and Grafana and Thanos ftw.
  • Developing the microservices behind api.openshift.com.
    • Actually operating those microservices.

I hear you might be interested a job like this.  Let me know, and we can sync up about it!

Maybe Stop Sending Me Emails about Performance :-)

[I’ve been meaning to write this post for several months]

Earlier this year I changed roles within Red Hat.  My new role is “OpenShift SaaS Architect”, and organizationally is part of Red Hat Service Delivery.

Service Delivery encompasses:

Basically, if you’ve had any interaction with OpenShift 4, you’ve likely consumed those services.

I’d been in my previous role for 7 years, and celebrated my 10th anniversary at Red Hat by being acquired by Big Blue.  My previous team (Red Hat Performance and Scale) afforded me endless technical challenges, opportunities to travel, present, help shape product and build engineering teams from the ground up.  Perhaps most importantly, I had the opportunity to mentor as many Red Hatters as I possibly could.

Red Hat Service Delivery allows me to broaden my technical and architecture skill set to areas outside of performance, scale and optimization, while letting me apply the many hard-fought lessons from prior chapters in my career.

Hopefully $subject makes a bit more sense now.  Onward!

Building Grafana from source on Fedora

Here are the official docs for building Grafana from source.  And below are my notes on how to build Grafana, starting from a clean Fedora 27 Cloud image.

# Install Dependencies
curl https://dl.yarnpkg.com/rpm/yarn.repo > /etc/yum.repos.d/yarn.repo
sudo yum install golang yarn rubygems ruby-devel redhat-rpm-config rpm-build git -y
gem install fpm
sudo yarn install --pure-lockfile
npm install -g yarn & yarn install

Setup the go environment.

# go environment
mkdir ~/go
export GOPATH=~/go
export PATH=$PATH:$(go env GOPATH)/bin

Download the various repositories required to build.  Here you could also clone your fork/branch of Grafana into $GOPATH/src.

# Pull sources required to build
go get github.com/grafana/grafana golang.org/x/sync/errgroup github.com/codegangsta/cli 
cd $GOPATH/src/github.com/grafana/grafana
npm install

Now you can make any sort of local changes, or just build from HEAD.

# go run build.go setup # takes 45 seconds
$ time go run build.go build pkg-rpm # takes about 7 minutes

The build will spit out an RPM in a folder called dist:

Created package {:path=>"./dist/grafana-5.0.0-1517715437pre1.x86_64.rpm"}

Docker operations slowing down on AWS (this time it’s not DNS)

I’m CC’d on mails when things get slow, but never when things work as expected or are fast…oh well.  Like an umpire in baseball, if we are doing our jobs, we are invisible.

Subject:  Docker operations slowing down

I reach for my trusty haiku for this type of thing:

Ah but in this scenario, it is something more…sinister (my word).  What could be more sinister than DNS, you say?  It’s the magical QoS system by which a cloud provider creatively rents you resources.  The system that allows for any hand-wavy repackaging of compute or network or disk into a brand new tier of service…

Platinum.  No, super Platinum.  What’s higher than platinum?  Who cares, we are printing money and customers love us because we have broken through their antiquated finance process.  We will gladly overpay via OpEx just to avoid that circus.

But I digress…

In this scenario, I was working with one of our container teams folks who had a report of CI jobs failing and someone had debugged a bit and pinned the blame on docker.  I watch the reproducer run.  It is running

docker run --rm fedora date

in a tight loop.  I watch as docker daemon gets through its 5000th loop iteration, and…still good to go.  On average, ~3 seconds to start a container and delete it.  Not too bad, certainly not something that a CI job shouldn’t be able to handle.  I continue to stare at tmux and then it happens…WHAM! 82 seconds to start the last container.  Ahh, good.  Getting a reproducer is almost always the hardest part of the process.  Once we have a tight debug loop, smart people can figure things out relatively quickly.

I am looking at top in another window, and I see systemd-udev at the top of the list…what the…

As much as I would love to blame DNS for this, I have a hunch this is storage related now, because the reproducer shouldn’t be doing anything on the network.  Now I am running ps in a loop and grepping for ” D “.  Why?  Because that is the process state when a thread is waiting on I/O.  I know this because of several terribly painful debugging efforts with multipath in 2010.  Looking back, it may have been those situations that have made me run screaming from filesystem and disk performance issues ever since 🙂

From man ps:

PROCESS STATE CODES
 Here are the different values that the s, stat and state output specifiers (header "STAT" or "S") will display to describe the state of a process:

 D uninterruptible sleep (usually IO)
 R running or runnable (on run queue)
 S interruptible sleep (waiting for an event to complete)
 T stopped by job control signal
 t stopped by debugger during the tracing
 W paging (not valid since the 2.6.xx kernel)
 X dead (should never be seen)
 Z defunct ("zombie") process, terminated but not reaped by its parent

Normally, processes oscillate between R and S, often imperceptibly (well, at least not something you see very often in top).  You can easily trace this with the systemtap script sleepingBeauties.stp if you really need to.  This script will print a backtrace of any thread that enters D state for a configurable amount of time.

Anyway here are the threads that are in D state.

root 426 0.4 0.0 0 0 ? D 16:10 0:08 [kworker/7:0]
root 5298 0.2 0.0 47132 3916 ? D 16:39 0:00 /usr/lib/systemd/systemd-udevd
root 5668 0.0 0.0 47132 3496 ? D 16:40 0:00 /usr/lib/systemd/systemd-udevd
root 24112 0.5 0.0 0 0 ? D 16:13 0:08 [kworker/u30:0]
root 5668 0.0 0.0 47132 3832 ? D 16:40 0:00 /usr/lib/systemd/systemd-udevd
root 5656 0.0 0.0 47132 3884 ? D 16:39 0:00 /usr/lib/systemd/systemd-udevd
root 29884 1.1 0.0 0 0 ? D 15:45 0:37 [kworker/u30:2]
root 5888 0.0 0.0 47132 3884 ? D 16:40 0:00 /usr/lib/systemd/systemd-udevd
root 5888 0.5 0.0 47132 3904 ? D 16:40 0:00 /usr/lib/systemd/systemd-udevd
root 5964 0.0 0.0 47132 3816 ? D 16:40 0:00 /usr/lib/systemd/systemd-udevd
root 29884 1.1 0.0 0 0 ? D 15:45 0:37 [kworker/u30:2]
root 5964 0.3 0.0 47132 3916 ? D 16:40 0:00 /usr/lib/systemd/systemd-udevd
root 5964 0.2 0.0 47132 3916 ? D 16:40 0:00 /usr/lib/systemd/systemd-udevd
root 24112 0.5 0.0 0 0 ? D 16:13 0:08 [kworker/u30:0]

That is interesting to me.  udevd is in the kernel’s path for allocate/de-allocate storage devices.  I am now convinced it is storage.  kworker is a workqueue kernel thread that fires when the kernel’s writeback watermarks (dirty pages) are hit.  For my extreme low latency work, I documented how to shove these in a corner in my Low Latency Tuning Guide for Red Hat Enterprise Linux 7.

I move over to another tmux pane and I try:

dd if=/dev/zero of=/root/50MB bs=1M count=10 oflag=sync

I know that if this does not complete in < 5 seconds, something is terribly hosed.  Aaaaaand it hangs.  This process now shows up in my ps loop looking for D state processes.  So I have it narrowed down.  Something is wrong with the storage on this VM, and it only shows up after 5000 containers are started (well, I am told it varies by a few thousand here and there).

This may seem like a tangent but I promise it is going somewhere:

Nearly two years ago, when we were first standing up openshift.com version 3 on AWS, we ran into a few eerily similar issues.  I remember that our etcd cluster would suddenly start freaking out (that is a technical term).  Leader elections, nodes going totally offline…And I remember working with our AWS contacts to figure it out.  At the time it was a little less well-known, and today just by googling it appears fairly well understood.  The issue with this reproducer turns out to be something called a BurstBalance.  BurstBalance is AWS business logic interfering with all that is good and holy.  If you purchase storage, you should be able to read and write from it, no?

As with all public cloud, you can do whatever you want…for a price.  BurstBalance is the creation of folks who want you to get hooked on great performance (gp2 can run at 3000+ IOPS), but then when you start doing something more than dev/test and run into these weird issues, you’re already hooked and you have no choice but to pay more for a service that is actually usable.  This model is seen throughout public cloud.  For example, take the preemptible instances on GCE or the t2 instance family on AWS.

I have setup my little collectd->graphite->grafana dashboard that I use for this sort of thing.  You can see things are humming along quite nicely for a while, and then…yeah.

Once the reproducer exhausts the gp2 volume’s BurstBalance, things go very, very badly.  Why?  Simple.  Applications were not written to assume that storage would ever slow down like this.  Issues in docker cascade back up the stack until finally a user complains that it took 5 minutes to start their pod.

The reason is that we have not paid our bounty to the cloud gods.

Here is BurstBalance and the magical AWS QoS/business logic in action.

You can see it looks a lot like my grafana graphs…quota is exhausted, and the IOPS drop to a trickle.

What would happen then if we did kneel at the alter of Bezos and pay him his tithe?  I will show you.

The reproducer is chugging along, until it slams into that magical AWS business logic.  Some QoS system somewhere jumps for joy at the thought of earning even more money.  This time, we will pay him his fee…for science.

You can see that our reproducer recovers (lower is better) once we flip the volume type to provisioned IOPS (io1)…this was done on the fly.  We set the io1 volume to 1000 IOPS (mostly random choice…) which is why it is slightly higher after the recovery than it was before the issue occurred.  gp2 can crank along really, really fast.  That is, until…


The take aways from this debugging session are:

  • Regardless of cloud provider, you pay a premium for both performance and determinism.
  • If you think you are saving money up front, just wait until the production issues start rolling in which, conveniently, can easily be solved by simply clicking a little button and upgrading to the next tier.  Actually, it is brilliant and I would do the same if I had the unicorn QoS system at my disposal, and was tasked with converting that QoS system into revenue.
  • I now must proactively monitor BurstBalance and flip volumes to io1 instead of let them hit the wall in production. Monitoring for this (per AWS documentation, use CloudWatch) is an additional fee appears to be included in their CloudWatch free tier.
  • Perhaps we flip all volumes to io1 proactively and then flip them back when the critical period is over.
  • One thing I ran out of time to verify is what happens to my BurstBalance if I flip to io1, then back to gp2?  Is my BurstBalance reset?  Probably not, but I haven’t done the leg work yet to verify.
  • We will do less I/O when using overlay2 (might just delay the inevitable).
  • All super critical things (like etcd) get io1 out of the gate.  No funny business.


Juggling backing disks for docker on RHEL7, using atomic storage migrate

Quick article on how to use the atomic storage commands to swap out an underlying6852258 storage device used for docker’s graph storage.

  • I am currently using overlay2 for docker storage, and /var/lib/docker is currently on my root partition :-/
  • I want to add a 2nd disk just for docker storage.
  • I want to keep my images, rather than have to download them again.

I have a few images in my system:

# docker images
 REPOSITORY TAG IMAGE ID CREATED SIZE
 docker.io/openshift/hello-openshift latest 305f93951299 3 weeks ago 5.635 MB
 docker.io/centos centos7 3bee3060bfc8 6 weeks ago 192.6 MB
 docker.io/monitoringartist/grafana-xxl latest 5a73d8e5f278 10 weeks ago 393.4 MB
 docker.io/fedora latest 4daa661b467f 3 months ago 230.6 MB
 docker.io/jeremyeder/c7perf latest 3bb51319f973 4 months ago 1.445 GB
 brew-pulp-docker01.redacted.redhat.com:8888/rhel7/rhel-tools latest 264d7d025911 4 months ago 1.488 GB
 brew-pulp-docker01.redacted.redhat.com:8888/rhel7 latest 41a4953dbf95 4 months ago 192.5 MB
 docker.io/busybox latest 7968321274dc 6 months ago 1.11 MB
 # df -h
 Filesystem Size Used Avail Use% Mounted on
 /dev/mapper/vg0-root 193G 162G 23G 88% /
 devtmpfs 16G 0 16G 0% /dev
 tmpfs 16G 0 16G 0% /dev/shm
 tmpfs 16G 804K 16G 1% /run
 tmpfs 16G 0 16G 0% /sys/fs/cgroup
 /dev/vdc1 100G 33M 100G 1% /var/lib/docker/overlay
 /dev/vda1 2.0G 549M 1.5G 28% /boot

All of docker’s storage right now consumes about 4GB.  It’s important to verify this because the migrate commands we’re about to walk through require this much space to complete the migration:

# du -hs /var/lib/docker
 3.9G /var/lib/docker

By default, the atomic migrate commands will write to /var/lib/atomic, so whatever filesystem holds that directory will need at least (in my case) 4GB free.

The migration process has several phases:

  1. Export any containers and images.
  2. Allow user to adjust storage on the system.
  3. Allow user to adjust storage configuration of docker.
  4. Import containers and images back into the new docker graph storage.

I’m using a VM with spinning disks so this takes a little longer than it otherwise might, but let’s start the export:

# time atomic storage export
 Exporting image: 5a73d8e5f278
 Exporting image: 3bb51319f973
 Exporting image: 7968321274dc
 Exporting image: 3bee3060bfc8
 Exporting image: 4daa661b467f
 Exporting image: 264d7d025911
 Exporting image: 41a4953dbf95
 Exporting image: 305f93951299
 Exporting volumes
 atomic export completed successfully

real 1m57.159s
 user 0m1.094s
 sys 0m6.190s

OK that went oddly smoothly, let’s see what it actually did:

# find /var/lib/atomic/migrate
 /var/lib/atomic/migrate
 /var/lib/atomic/migrate/info.txt
 /var/lib/atomic/migrate/containers
 /var/lib/atomic/migrate/images
 /var/lib/atomic/migrate/images/4daa661b467f23f983163d75f0b87744cd3d88a2aed11be813d802606e8f13df
 /var/lib/atomic/migrate/images/3bee3060bfc81c061ce7069df35ce090593bda584d4ef464bc0f38086c11371d
 /var/lib/atomic/migrate/images/7968321274dc6b6171697c33df7815310468e694ac5be0ec03ff053bb135e768
 /var/lib/atomic/migrate/images/264d7d0259119cf980fb95759865938765ccb3f1aa24600cbac49bea6b5b8cfb
 /var/lib/atomic/migrate/images/305f939512995147aa964bceef36a4a83226fae523c52b011fd69c9a229e3460
 /var/lib/atomic/migrate/images/5a73d8e5f27861df210b03ca872530b6ab8b20b6a0d9c815022da3e0812df089
 /var/lib/atomic/migrate/images/3bb51319f9734038d7b2d3c67cae6c25bbd9df18163cd7810ffcff952cbe0608
 /var/lib/atomic/migrate/images/41a4953dbf957cfc562935239a3153a5da6101f32fa30da7b4a506f23cfcde9d
 /var/lib/atomic/migrate/volumes
 /var/lib/atomic/migrate/volumes/volumeData.tar.gz

Seems reasonable…incidentally that info.txt just includes the name of the storage driver used at the time migrate was executed.

# du -hs /var/lib/atomic
3.8G /var/lib/atomic

OK let’s do the deed:

# atomic storage reset
 Docker daemon must be stopped before resetting storage

Oh, I guess that would make sense.

# systemctl stop docker
# atomic storage reset

OK, at this point /etc/sysconfig/docker-storage is reset to it’s default state, and I have nothing in my docker graph storage.

Because I want to continue to use overlay2, I will use the atomic storage modify command to make that so:

# atomic storage modify --driver overlay2
# cat /etc/sysconfig/docker-storage
 DOCKER_STORAGE_OPTIONS="--storage-driver overlay2 "

Things are looking good so far.

Now about adding more storage.

  • I have added a new virtual storage device to my VM called /dev/vdc1
  • I have partitioned and formatted it with XFS filesystem.
  • I have mounted it at /var/lib/docker and setup an fstab entry.
# lsblk
 NAME MAJ:MIN RM SIZE RO TYPE MOUNTPOINT
 vda 252:0 0 200G 0 disk
 ├─vda1 252:1 0 2G 0 part /boot
 └─vda2 252:2 0 198G 0 part
 ├─vg0-swap 253:0 0 2G 0 lvm [SWAP]
 └─vg0-root 253:1 0 196.1G 0 lvm /
 vdb 252:16 0 100G 0 disk
 └─vdb1 252:17 0 100G 0 part
 vdc 252:32 0 100G 0 disk
 └─vdc1 252:33 0 100G 0 part /var/lib/docker

At this point we are ready to restart docker and import the images from my previous storage.  First let me verify that it’s OK.

# systemctl start docker
# docker info|grep -i overlay2
 Storage Driver: overlay2

Cool, so docker started up correctly and it has the overlay2 storage driver that I told it to use with the atomic storage modify command (from previous step).

Now for the import…

# time atomic storage import
 Importing image: 4daa661b467f
 ae934834014c: Loading layer [==================================================>] 240.3 MB/240.3 MB
 Loaded image: docker.io/fedora:latest
 Importing image: 3bee3060bfc8
 dc1e2dcdc7b6: Loading layer [==================================================>] 200.2 MB/200.2 MB
 Loaded image: docker.io/centos:centos7
 Importing image: 7968321274dc
 38ac8d0f5bb3: Loading layer [==================================================>] 1.312 MB/1.312 MB
 Loaded image: docker.io/busybox:latest
 Importing image: 264d7d025911
 827264d42df6: Loading layer [==================================================>] 202.3 MB/202.3 MB
 9ca8c628d8e7: Loading layer [==================================================>] 10.24 kB/10.24 kB
 a03f55f719da: Loading layer [==================================================>] 1.336 GB/1.336 GB
 Loaded image: brew-pulp-docker01.redacted.redhat.com:8888/rhel7/rhel-tools:latest
 Importing image: 305f93951299
 5f70bf18a086: Loading layer [==================================================>] 1.024 kB/1.024 kB
 c618fb2630cb: Loading layer [==================================================>] 5.637 MB/5.637 MB
 Loaded image: docker.io/openshift/hello-openshift:latest
 Importing image: 5a73d8e5f278
 8d4d1ab5ff74: Loading layer [==================================================>] 129.4 MB/129.4 MB
 405d1c3227e0: Loading layer [==================================================>] 3.072 kB/3.072 kB
 048845c41855: Loading layer [==================================================>] 277.2 MB/277.2 MB
 Loaded image: docker.io/monitoringartist/grafana-xxl:latest
 Importing image: 3bb51319f973
 34e7b85d83e4: Loading layer [==================================================>] 199.9 MB/199.9 MB
 ab7578fbc6c6: Loading layer [==================================================>] 3.072 kB/3.072 kB
 3e89505f5573: Loading layer [==================================================>] 58.92 MB/58.92 MB
 753668c55633: Loading layer [==================================================>] 1.169 GB/1.169 GB
 d778d7335b8f: Loading layer [==================================================>] 11.98 MB/11.98 MB
 5cd21edffb34: Loading layer [==================================================>] 45.1 MB/45.1 MB
 Loaded image: docker.io/jeremyeder/c7perf:latest
 Importing image: 41a4953dbf95
 Loaded image: brew-pulp-docker01.redacted.redhat.com:8888/rhel7:latest
 Importing volumes
 atomic import completed successfully
 Would you like to cleanup (rm -rf /var/lib/atomic/migrate) the temporary directory [y/N]n
 Please restart docker daemon for the changes to take effect

 real 1m23.951s
 user 0m1.391s
 sys 0m4.095s

Again went smoothly.  I opted not to have it automatically clean up /var/lib/atomic/migrate automatically because I want to verify a thing or two first.

Let’s see what’s on my new disk:

# df -h /var/lib/docker
Filesystem Size Used Avail Use% Mounted on
/dev/vdc1 100G 3.9G 97G 4% /var/lib/docker

OK that looks reasonable.  Let’s start docker and see if things imported correctly:

# systemctl restart docker

# docker images
 REPOSITORY TAG IMAGE ID CREATED SIZE
 docker.io/openshift/hello-openshift latest 305f93951299 3 weeks ago 5.635 MB
 docker.io/centos centos7 3bee3060bfc8 6 weeks ago 192.6 MB
 docker.io/monitoringartist/grafana-xxl latest 5a73d8e5f278 10 weeks ago 393.4 MB
 docker.io/fedora latest 4daa661b467f 3 months ago 230.6 MB
 docker.io/jeremyeder/c7perf latest 3bb51319f973 4 months ago 1.445 GB
 brew-pulp-docker01.redacted.redhat.com:8888/rhel7/rhel-tools latest 264d7d025911 4 months ago 1.488 GB
 brew-pulp-docker01.redacted.redhat.com:8888/rhel7 latest 41a4953dbf95 4 months ago 192.5 MB
 docker.io/busybox latest 7968321274dc 6 months ago 1.11 MB

Images are there.  Can I run one?

# docker run --rm fedora pwd
/

Indeed I can.  All seems well.

This utility is very handy in scenarios where you want to do some surgery on the backend storage, but do not want to throw away/download images and containers.  I could envision using this utility when

  • Moving from one graph driver to another.  Note that we have SELinux support coming to overlay2 in RHEL 7.4.
  • Perhaps you have a lot of images or containers and slow internet.

Either way, this process was about as smooth as it could be…and a very clean UX, too.

Building KDAB hotspot ‘perf’ visualization tool on Fedora

As any respectable software performance person knows, perf is your best (only?) friend. For example, perf report -g has shined a light into the deepest, darkest corners of debugging territory.  Since you asked, it can happily run in a container, too (albeit requiring elevated privileges, but we’re debugging here…).

Typically console formatted output is fine for grokking perf reports, but having recently become addicted to go’s pprof visualization (dot format), handy flame graphs, and on the morbid occassion, VTune, I started looking around for a way to more clearly understand a particular perf recording.

Googling turned up an interesting QT-based tool called hotspot by a company called KDAB.  Screenshots indicate it might be worth kicking the tires.

After some bouncing around figuring out Fedora equivalent package names, I was able to quickly build and run hotspot.  I ran a quick perf record to see if it was going to work at all:

$ sudo perf record --call-graph dwarf sleep 10
$ ./bin/hotspot ./perf.data

And voila…

summary

Folks at KDAB even included a built-in flame graph:

flame_graph

Interface is clean, bug-free and useful.  Trying to load a large perf.data file was a bit ugly and RAM-intensive; I would likely stick to command-line parsing for those.  Or, as we do in pbench, reduce the collection frequency to 100Hz and take bite-sized samples over the life of the test.

nsinit: per-container resource monitoring of Docker containers on RHEL/Fedora

The use-case for per-application resource counters

Administrators of *NIX-based systems are quite accustomed to viewing resource counters strewn throughout the system, in places like /proc, /sys and more recently /cgroup or /sys/fs/cgroup.  With the release of RHEL6 came widespread enterprise adoption of Control Groups (cgroups), which had been implemented steadily over a series of years, and vetted both there as well as in Fedora (RHEL’s upstream).

Implementing cgroups not only let sysadmins carve up a single OS into multiple logical partitions, it also bought them per-cgroup counters that the kernel maintains.  That’s in addition to common use-cases such as quality of service guarantees or charge-back.

Docker’s unique twist

With the recent uptick in adoption of Linux containers (Docker encapsulates several mature technologies into an impressive usability package), administrators might be wondering where the per-container resource counters are.  We’re in luck!  Since Docker heavily relies on Cgroups, many of the counters that sysadmins are familiar with “just work”.  They could benefit from some usability improvements, but if you’re comfortable spelunking through the cgroup VFS, you can dig them out fairly easily.

I should note that the specific hierarchy and commands below are specific to RHEL and Fedora, so you might have to customize some paths or package names for your system.

In the most recent versions of Fedora, engineers have begun building and shipping a binary called ‘nsinit‘, which is part of libcontainer, which is the “execution driver” for Docker.  nsinit is a very powerful debugging utility that lets sysadmins not only view per-container resource counters, but also view the container’s runtime configuration and “jump into” a running container.

How to use the nsinit utility

First you should grab a copy from Fedora, or build it yourself.  Building it yourself is an unnecessarily complicated exercise; so I’m glad they started building it for Fedora so you can just do:

# yum install --enablerepo=updates-testing golang-github-docker-libcontainer

$ rpm -qf `which nsinit`
golang-github-docker-libcontainer-1.1.0-7.git29363e2.fc20.x86_64

# nsinit
NAME:
 nsinit - A new cli application

USAGE:
 nsinit [global options] command [command options] [arguments...]

VERSION:
 0.1

COMMANDS:
 exec execute a new command inside a container
 init runs the init process inside the namespace
 stats display statistics for the container
 config display the container configuration
 nsenter init process for entering an existing namespace
 pause pause the container's processes
 unpause unpause the container's processes
 help, h Shows a list of commands or help for one command

I’ll cover the most useful of nsinit’s capabilities; config, stats and exec.

Note:  nsinit currently requires that you run it while you're inside the container's state directory.  So from here on, all commands assume you're in there.

So, something like this:

# docker ps -q
4caad549289

# CID=`docker ps -q`
# cd /var/lib/docker/execdriver/native/$CID*
# ll
total 8
-rw-r-xr-x. 1 root root 3826 Sep  1 20:11 container.json
-rw-r--r--. 1 root root  114 Sep  1 20:11 state.json

Those files are plain-text readable, although not very human-readable.  nsinit pretty-prints these files.  For example, an abridged verison of the output of nsinit config (full version here).  Note that you can get much of this info (but not all) from docker inspect.

# nsinit config

{
 "mount_config": {
 "mounts": [
 {
 "type": "bind",
 "source": "/var/lib/docker/init/dockerinit-1.1.1",
 "destination": "/.dockerinit",
 "private": true
 },
 {
 "type": "bind",
 "source": "/etc/resolv.conf",
 "destination": "/etc/resolv.conf",
 "private": true
 },
<snip>
 "mount_label": "system_u:object_r:svirt_sandbox_file_t:s0:c631,c744"
 },
 "hostname": "4caad5492898",
 "environment": [
 "HOME=/",
 "PATH=/usr/local/sbin:/usr/local/bin:/usr/sbin:/usr/bin:/sbin:/bin:/goroot/bin:/gopath/bin",
 "HOSTNAME=4caad5492898",
 "DEBIAN_FRONTEND=noninteractive",
 "GOROOT=/goroot",
 "GOPATH=/gopath"
 ],
 "namespaces": {
 "NEWIPC": true,
 "NEWNET": true,
 "NEWNS": true,
 "NEWPID": true,
 "NEWUTS": true
 },
 "capabilities": [
 "CHOWN",
 "DAC_OVERRIDE",
 "FOWNER",
 "MKNOD",
 "NET_RAW",
 "SETGID",
 "SETUID",
 "SETFCAP",
 "SETPCAP",
 "NET_BIND_SERVICE",
 "SYS_CHROOT",
 "KILL"
 ],
 "networks": [
 {
 "type": "loopback",
 "address": "127.0.0.1/0",
 "gateway": "localhost",
 "mtu": 1500
 },
 {
 "type": "veth",
 "bridge": "docker0",
 "veth_prefix": "veth",
 "address": "172.17.0.6/16",
 "gateway": "172.17.42.1",
 "mtu": 1500
 }
 ],
 "cgroups": {
 "name": "4caad5492898f1a4230353de15e2acfc05809c69d05ec7289c6a14ef6d57b195",
 "parent": "docker",
 "allowed_devices": [
<snip>
 "process_label": "system_u:system_r:svirt_lxc_net_t:s0:c631,c744",
 "restrict_sys": true
}

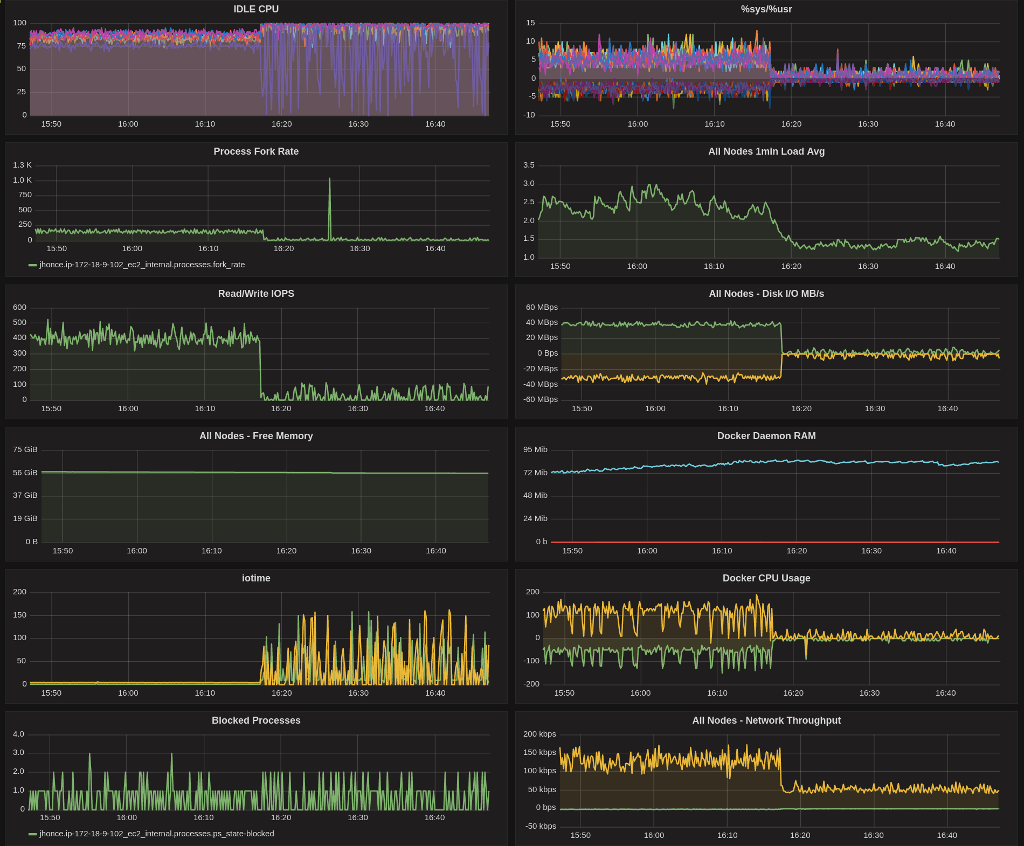
The stats mode is far more interesting.  nsinit reads cgroup counters for CPU and memory usage.  The network statistics come from /sys/class/net/<EthInterface>/statistics.  From here you can see how much memory your application is using, chart it’s growth, watch CPU utilization, cross-check data from other tools, etc.

{
 "network_stats": {
 "rx_bytes": 180568,
 "rx_packets": 89,
 "tx_bytes": 28316,
 "tx_packets": 92
 },
 "cgroup_stats": {
 "cpu_stats": {
 "cpu_usage": {
 "total_usage": 985559718,
 "percpu_usage": [
 43613750,
 79789656,
 132486590,
 78759739,
 49063680,
 60703059,
 36277458,
 35919550,
 36329424,
 20096103,
 8148695,
 25279255,
 0,
 0,
 0,
 6144761,
 14814784,
 2612915,
 95162480,
 33853872,
 114861235,
 71115914,
 6533416,
 33993382
 ],
 "usage_in_kernelmode": 510000000,
 "usage_in_usermode": 440000000
 },
 "throlling_data": {}
 },
 "memory_stats": {
 "usage": 27992064,
 "max_usage": 29020160,
 "stats": {
 "active_anon": 4411392,
 "active_file": 3149824,
 "cache": 22278144,
 "hierarchical_memory_limit": 9223372036854775807,
 "hierarchical_memsw_limit": 9223372036854775807,
 "inactive_anon": 0,
 "inactive_file": 19128320,
 "mapped_file": 3723264,
 "pgfault": 94783,
 "pgmajfault": 25,
 "pgpgin": 19919,
 "pgpgout": 13902,
 "rss": 4460544,
 "rss_huge": 2097152,
 "swap": 0,
 "total_active_anon": 4411392,
 "total_active_file": 3149824,
 "total_cache": 22278144,
 "total_inactive_anon": 0,
 "total_inactive_file": 19128320,
 "total_mapped_file": 3723264,
 "total_pgfault": 94783,
 "total_pgmajfault": 25,
 "total_pgpgin": 19919,
 "total_pgpgout": 13902,
 "total_rss": 4460544,
 "total_rss_huge": 2097152,
 "total_swap": 0,
 "total_unevictable": 0,
 "unevictable": 0
 },
 "failcnt": 0
 },
 "blkio_stats": {}
 }
}

nsenter is commonly used to run a command inside an existing container, something like

# nsenter -m -u -n -i -p -t 19119 bash

Where 19119 is the PID of a process in the container.  Ugly.  nsinit makes this slightly easier (at least IMHO):

# nsinit exec cat /etc/hostname
4caad549289
# nsinit exec bash
bash-4.2# exit

nsinit’s capabilities and reported statistics are incredibly useful when debugging the implementation of QoS for each container, implementing/verifying resource-ceilings/guarantees, and for a more complete understanding of what your containers are doing.

This area is fast-moving…I did want to call out two other important developments, which should ultimately have more broad applicability than nsinit.

Google has published a project called cAdvisor that provides a basic web interface, but more importantly an API for higher layers (such as Kubernetes) to use.

Red Hat has proposed container support for Performance Co-Pilot, a system-level performance monitoring utility in RHEL7, along with goals of teaching many other tools about containers.

Using SCHED_FIFO in Docker containers on RHEL

Well, I’ve been asked about this quite a few times now, so I figured a blog post was in order…

When I was trying to get cyclictest running in a container, I ran into a little snag. I couldn’t run realtime prio tasks inside a container by default. I checked all the normal ulimit stuff for RT, but no dice.  But I did find a way (ugly).

If you do want to run SCHED_FIFO tasks you can in fact do so, like this:

Run a privileged container (because of cap_sys_nice being dropped by docker) adding this to your docker run command:

--priveleged

Or, if you  have a more recent version of Docker, add this to your docker run command:

--cap-add=sys_nice

Set rt_runtime_us > 0 for the parent cgroup of where docker containers end up in the heirarchy:

# echo 950000 > /sys/fs/cgroup/cpu/system.slice/cpu.rt_runtime_us

Still blocked:

# docker run -it cyclictest bash
root@231fbb116315: ~ # chrt -f 1 w
chrt: failed to set pid 0's policy: Operation not permitted

3. Update cpu.rt_runtime_us for the new container:

# echo 900000 > `find /sys/fs/cgroup/cpu/system.slice|grep docker|grep scope|grep cpu.rt_runtime_us`

Now it works:

root@231fbb116315: ~ # chrt -f 1 w
11:01:56 up 26 min, 0 users, load average: 0.08, 0.05, 0.05
USER TTY LOGIN@ IDLE JCPU PCPU WHAT

Yes, it should be made easier…the question is at what level do we integrate this; Docker or orchestration.

For more info, see this Red Hat Bugzilla.

Getting Started with Performance Analysis of Docker

Docker introduces some intriguing usability, packaging and deployment patterns.  These new patterns offer the potential to effect massive improvements to the enterprise application development and operations specialties.  Containers also offer the promise of bare metal performance while offering some amount of isolation as well.  But can they deliver on that promise ?

Since the early part of January, the Performance Engineering Group at Red Hat has run huge amounts of microbenchmarks, benchmarks and application workloads in Docker containers.  The output of that effort has been a steady stream of lessons learned and advice/guidance given to our product architects and developers.  How dense can we go ?  How fast can it go ?  Are these defaults “sane” ?  What NOT to do…etc.

Disclaimer:  as anyone who has worked with Docker knows, it’s a project under heavy development.  I mention that because this blog post includes code snippets and observations that are tied to specific experiments and Docker/kernel versions.  YMMV, the answer of course is “it depends”, and so on.

Performance tests we’ve pointed at Docker containers

We’ve done a whole bunch of R&D testing with bleeding edge, “niche” hardware and software to push and pull Docker containers in completely unnatural ways.   Based on our choice of benchmarks, you can see that the initial approach was to calculate the precise overhead of containers as compared to bare metal (Red Hat’s Project Atomic will support bare metal deployment of containers).  Of course we are also gathering numbers with VMs to compare and containers in VMs (which might be the end-game, who knows…) via OpenStack etc.

Starting at the core, and working our way to the heaviest, pushing all the relevant subsystems to their limits:

  • In-house timing syscall benchmarks (including vdso), libMicro
  • Linpack, single and double precision, Streams
  • Various incantations of sysbench (oltp and cpu)
  • iozone, smallfile, spinning disk, ssd and NAND flash
  • netperf on 10g and 40g, SR-IOV (pipework)
  • OpenvSwitch with VXLAN offload-capable NICs
  • Traditional “large” applications, i.e. business analytics
  • Addressing single-host vertical scalability limits by fixing the Linux kernel and fiddling some bits in Docker.
  • Using OpenvSwitch to get past the spanning-tree limitations of # of ports per bridged-interface.

All of these mine-sweeping experiments (lots more to come!) have allowed us to find and fix plenty of issues and document best-practices that we hope will lead to a great customer experience.

BTW if you’re interested in serious, low level, Enterprise-grade performance analysis and tuning for Linux containers (or in general!), let’s have a chat @DockerCon … I’ll be one of the guys in a Project Atomic T-shirt 🙂

Unique Docker Philosophies

  • Ease of use:  Docker automates the use of existing Linux kernel technologies into an easily consumable format.  Setup and administration of traditionally disjoint subsystems (cgroups, namespaces, iptables, selinux) are encapsulated by Docker.
  • Packaging:  Docker specifies an image/packaging format that allows an application to be packaged with it’s full userspace requirements.  No longer is there a necessary interaction between system-level packages (other than the kernel) with the containerized application.  The application sees only what is provided inside the container.  This can be for example, a specific version of gcc or php that differs from what the host OS provides.  I keep drawing an analogy to BIND “views”.

Performance interests aside, those are the 2 main selling points for me, and the benefits of those cannot be overstated.

Surprise, we added some enterprise-y stuff

Docker learns about systemd

Red Hat has taught Docker to use systemd, rather than sysvinit.  I mention this because (depending on who you’re talking to) it may be controversial.  But I believe that the true promise of containers on Linux relies on specific capabilities that systemd provides:  at least init dbus messaging, remote capabilities, cgroups API, remote journaling.

Docker systemd unit-file override:

  • systemd supports “.d”-style overrides for installed unit-files.  This is the correct way to customize the defaults for any systemd unit-file.  Overrides go in /etc/systemd/system/.
  • I need an override for my testing, because I want to use my own bridge device and I want to play with the MTU as well.  By default, Docker creates a bridge called docker0 and assigns IP addresses from that pool, useful for development, not production.  For production, I guess folks will want to set up their own bridge (or pass through a device, macvlan, whatever).
  • Assuming you have a bridge that you want to use, create a new systemd unit override file called /etc/systemd/system/docker.service.  Here is an example where I’ve set Docker to use a bridge named ‘br1’ and I also added ‘-D’  to enable debug logging for the Docker daemon.  br1 is on my test network, on an IP range that I control.  Finally, I’ve bumped the MTU to 9000 for some throughput tests…
ExecStart=/usr/bin/docker -d --selinux-enabled -H fd:// -b br1 -D --mtu=9000

Also Stephen Tweedie spotted unnecessary memory consumption in systemd mount/umount handling, which was fixed in record time by Lennart Poettering 🙂

Docker learns about SELinux

Red Hat has brought SELinux support to Docker.  If you’ve been using Red Hat products for any length of time, you know security is a first order concern for us.  Look at the stats for critical CVE reponse time…adding SELinux support to Docker should come as no surprise 🙂  Shout out to the wizards in Red Hat’s Security Response Team, btw.

After the initial bring-up, SELinux support has been fairly painless for us in the Performance Group.  Dan Walsh is doing a talk called “SELinux and Docker” at DockerCon next week (June 10, 2pm, actually).  To give you a sense of how serious Red Hat is about containers and Docker, I should also mention Red Hat’s CTO Brian Stevens is doing one of the keynotes and we’re Platinum sponsoring.  Here’s the very high level picture:

Red_Hat-Project-Atomic-Introduction

Dockerfile for Performance Analysis

What is a Dockerfile?

Why create a Dockerfile specifically for Performance Analysis?

  • One of the core principals of Docker images is that they are absolutely as small as possible.  This is because when a user wants to use your container image, they must pull it over the network.  Docker hosts a registry at http://index.docker.io.  Folks may stand up their own internal registries as well, where bandwidth is a bit less of a concern, images can contain site-specific customizations, intellectual property, licensed software, etc.
  • Our engineers have been working hard to reduce the base image size.  Therefore, the base images include the smallest usable package set, plus necessary tooling/package management utilities (yum) to pull in anything else the user needs inside their containers.  Think @core on steriods.
  • Because of the size constraints on the base image, we have to layer on our usual set of Performance Analysis tools via Dockerfile rather than kickstart.
  • A very common question I get from the field is to provide a precise list of performance analysis packages/tools that I would recommend in their base RHEL images.  So I put a slide in the Summit deck this year:

helpful_utilities

Example Dockerfile

It’s not all that complicated, but includes lots of helpful utilities for characterizing workloads running inside containers.  You might see that sysstat is missing; that’s because I monitor that information on the host.  This is one critical differentiation between virtualization, and containers:  the VCPUs of a KVM guest exist as processes in the host.  With containers, the actual containerized binary shows up in the process list of the host.  Note:  the PID namespace ensures isolation of process tables between containers.

FROM rhel7:latest
MAINTAINER perf <perf@domain.com>

RUN yum install -q -y bc blktrace btrfs-progs ethtool gcc git gnuplot hwloc iotop iproute iputils less mailx man-db netsniff-ng net-tools numactl numactl-devel openssh-clients openssh-server passwd perf procps-ng psmisc screen strace tcpdump vim-enhanced wget xauth which 

RUN git clone http://whatever/project.git

ENV HOME /root
ENV USER root
WORKDIR /root
EXPOSE 22

You might also notice that I’m installing numactl and hwloc.  That’s because recent versions of Docker provide access to sysfs hardware topology tables from the host, allowing you to apply similar tuning techniques as you would on bare metal on containerized processes.  We had some pretty funny test automation explosions when sysfs hardware topology was not exposed 🙂  Side note, you can’t tune IRQ affinity from a non-privileged container, but luckily IRQ balance really does a great job these days (even knows about PCI-locality).  Privileged containers CAN program IRQ affinity.

CPU and memory affinity is another important differentiation between VMs and containers.   In a container,  core1 is core1 on the host, core2 is core2 etc (depending on your cgroups config).  With VMs you apply specific vcpupin/numatune/emulatorpin commands in order to ensure VCPU threads and their memory utilize specific CPUs/memory banks.  The process of properly applying affinity to KVM guests is well-documented in Red Hat’s Virtualization Tuning and Optimization Guide.  Naturally, when we characterize VMs and containers inside VMs, we often apply much of that.

How to build a container with the Performance Dockerfile

# time docker build --no-cache=true -t r7perf --rm=true - < Dockerfile_r7perf

# docker run -it r7perf bash

root@7d7b16277784: / # exit

How do I add my benchmark/tool/workload to this Docker container?

  • Ideally, a pre-configured set of scripts would be committed to your own git repo, and pulled into this container automatically in the Dockerfile (RUN git clone http:///whatever/project.git).  This is our approach.
  • Add a RUN command to the Dockerfile that uses yum, wget, git or similar to pull in, install and configure your software.
  • Run a container interactively, then pull down the benchmark manually.  This is our fallback for some of the more challenging/complex benchmarks and under-load analysis.

How to get a benchmark running inside a Docker container

Let’s take for example, sysbench.

  • I’ve built RPMs for sysbench for RHEL6 and RHEL7 and committed them to our git repository.  I’ve also committed my driver script called run-sysbench.sh. (this isn’t mandatory, but using git makes things a LOT easier).
    • You can add a RUN statement to the Dockerfile that wget’s your benchmark/tarball from somewhere, or a RUN that does another git clone of some other repository.
    • However you would normally transfer your code to a new machine, you can do the same thing in the Dockerfile.
  • Once the container build is complete, launch a container, and kick off your workload.  run-sysbench.sh could be any driver/wrapper script that you’ve got.
host# docker run -it --privileged r7perf bash

container# yum install -y bench/sysbench/rhel7/*rpm mariadb-server mariadb ; cd bench/sysbench

container# ./run-sysbench.sh oltp docker

...run-sysbench.sh completes and spits out an output/logfile that it copies off the container (rsync, ftp whatever).
  • That’s it.  When the script finishes and you’ve copied off the results (part of run-sysbench.sh), you can ‘exit’ the container.
  • Astute observers will have noticed that I snuck ‘–privileged’ onto the command line above.  That is because my run-sysbench.sh wants to drop_caches, and that’s not something permitted to a container by default.  As an alternative, instead of using privileges, a container could ssh into it’s host machine as root and drop_cache from there.  See Docker source capabilitiesdaemon/execdriver/lxc/init.go for the additional capabilities afforded to “privileged” containers.
  • Fun example:  create 100 containers running apache, in 14 seconds 🙂
# time for i in $(seq 100) ; do docker run -d r7perf /usr/sbin/httpd -DFOREGROUND ; done

43bd1efc8fd4d8cedcced29cedf7176286077661a4df02c27756b3959a9fa75f
de1cc33c8f73d9ebce8676ab52da5e1da9518c649af87688f4a89dbda197c7cb
...

real 0m14.159s
user 0m0.386s
sys 0m0.386s

It’s not very often that a new technology comes up that creates a whole new column for performance characterization.  But containers have done just that, and so it’s been quite the undertaking.  There are still many tests variations to run, but so far we’re encouraged.

That said, I have to keep reminding myself that performance isn’t always the first concern for everyone (*gasp*).  The packaging, development and deployment workflow that breaks the ties between host userspace and container userspace has frankly been a breath of fresh air.

Performance Analysis and Tuning Videos from Red Hat Summit 2014

This year’s Red Hat Summit took place at the Moscone Center in downtown San Francisco.  Red Hat’s Performance Engineering team had it’s opportunity to showcase our contributions to products and customers with presentations on performance tuning for RHEL, databases, and Red Hat Storage (with behind-the-scenes/support data for many other talks).

Summit is always exciting, because as a company, Red Hat finally gets to reveal what we’ve been cooking.  For example, you may have seen Jim Whitehurst  announce during his keynote, a RHEL variant for containers called Red Hat Enterprise Linux Atomic Host via the open source Project Atomic.  Having witnessed the internal development velocity and excitement from customers/partners at Summit around Atomic in particular, I am just so happy for our extremely hard working development teams who are doing everything out in the open, the “Red Hat Way”, as it absolutely should be.

Red Hat made so many announcements, I’d encourage you to look at their Twitter feed to catch it all.

This year marked my 2nd turn as a partner in the Performance Analysis and Tuning presentation.  If you haven’t attended a Summit before, this 2-part session is typically (this year included) one of the most highly anticipated and attended sessions.  Our A/V team has already posted the videos for both parts:  Part 1 and Part 2.

Red Hat also announced the imminent availability of the Red Hat Enterprise Linux 7 Release Candidate.  The RC includes quite a few performance improvements and important fixes (including this one, which I mentioned during one of the perf talks).  To compliment the RC, our docs team has also refreshed the official RHEL7 Documentation, which means I don’t have to keep pointing people to my blog to figure out nohz_full anymore 🙂

If you haven’t tried the RHEL7 beta, I’d strongly encourage you look at the RC when it hits RHN.  It’s also probably best that you do a fresh install.

From helping characterize RHEL7, to OpenStack, Red Hat Storage, OpenShift and Docker, it’s been just an insane few years.   The most fun I’ve had in my career, too.   #opensource rocks!