I’m CC’d on mails when things get slow, but never when things work as expected or are fast…oh well. Like an umpire in baseball, if we are doing our jobs, we are invisible.
Subject: Docker operations slowing down
I reach for my trusty haiku for this type of thing:

Ah but in this scenario, it is something more…sinister (my word). What could be more sinister than DNS, you say? It’s the magical QoS system by which a cloud provider creatively rents you resources. The system that allows for any hand-wavy repackaging of compute or network or disk into a brand new tier of service…
Platinum. No, super Platinum. What’s higher than platinum? Who cares, we are printing money and customers love us because we have broken through their antiquated finance process. We will gladly overpay via OpEx just to avoid that circus.
But I digress…
In this scenario, I was working with one of our container teams folks who had a report of CI jobs failing and someone had debugged a bit and pinned the blame on docker. I watch the reproducer run. It is running
docker run --rm fedora date
in a tight loop. I watch as docker daemon gets through its 5000th loop iteration, and…still good to go. On average, ~3 seconds to start a container and delete it. Not too bad, certainly not something that a CI job shouldn’t be able to handle. I continue to stare at tmux and then it happens…WHAM! 82 seconds to start the last container. Ahh, good. Getting a reproducer is almost always the hardest part of the process. Once we have a tight debug loop, smart people can figure things out relatively quickly.
I am looking at top in another window, and I see systemd-udev at the top of the list…what the…
As much as I would love to blame DNS for this, I have a hunch this is storage related now, because the reproducer shouldn’t be doing anything on the network. Now I am running ps in a loop and grepping for ” D “. Why? Because that is the process state when a thread is waiting on I/O. I know this because of several terribly painful debugging efforts with multipath in 2010. Looking back, it may have been those situations that have made me run screaming from filesystem and disk performance issues ever since 🙂
From man ps:
PROCESS STATE CODES
 Here are the different values that the s, stat and state output specifiers (header "STAT" or "S") will display to describe the state of a process:

 D uninterruptible sleep (usually IO)
 R running or runnable (on run queue)
 S interruptible sleep (waiting for an event to complete)
 T stopped by job control signal
 t stopped by debugger during the tracing
 W paging (not valid since the 2.6.xx kernel)
 X dead (should never be seen)
 Z defunct ("zombie") process, terminated but not reaped by its parent
Normally, processes oscillate between R and S, often imperceptibly (well, at least not something you see very often in top). You can easily trace this with the systemtap script sleepingBeauties.stp if you really need to. This script will print a backtrace of any thread that enters D state for a configurable amount of time.
Anyway here are the threads that are in D state.
root 426 0.4 0.0 0 0 ? D 16:10 0:08 [kworker/7:0]
root 5298 0.2 0.0 47132 3916 ? D 16:39 0:00 /usr/lib/systemd/systemd-udevd
root 5668 0.0 0.0 47132 3496 ? D 16:40 0:00 /usr/lib/systemd/systemd-udevd
root 24112 0.5 0.0 0 0 ? D 16:13 0:08 [kworker/u30:0]
root 5668 0.0 0.0 47132 3832 ? D 16:40 0:00 /usr/lib/systemd/systemd-udevd
root 5656 0.0 0.0 47132 3884 ? D 16:39 0:00 /usr/lib/systemd/systemd-udevd
root 29884 1.1 0.0 0 0 ? D 15:45 0:37 [kworker/u30:2]
root 5888 0.0 0.0 47132 3884 ? D 16:40 0:00 /usr/lib/systemd/systemd-udevd
root 5888 0.5 0.0 47132 3904 ? D 16:40 0:00 /usr/lib/systemd/systemd-udevd
root 5964 0.0 0.0 47132 3816 ? D 16:40 0:00 /usr/lib/systemd/systemd-udevd
root 29884 1.1 0.0 0 0 ? D 15:45 0:37 [kworker/u30:2]
root 5964 0.3 0.0 47132 3916 ? D 16:40 0:00 /usr/lib/systemd/systemd-udevd
root 5964 0.2 0.0 47132 3916 ? D 16:40 0:00 /usr/lib/systemd/systemd-udevd
root 24112 0.5 0.0 0 0 ? D 16:13 0:08 [kworker/u30:0]
That is interesting to me. udevd is in the kernel’s path for allocate/de-allocate storage devices. I am now convinced it is storage. kworker is a workqueue kernel thread that fires when the kernel’s writeback watermarks (dirty pages) are hit. For my extreme low latency work, I documented how to shove these in a corner in my Low Latency Tuning Guide for Red Hat Enterprise Linux 7.
I move over to another tmux pane and I try:
dd if=/dev/zero of=/root/50MB bs=1M count=10 oflag=sync
I know that if this does not complete in < 5 seconds, something is terribly hosed. Aaaaaand it hangs. This process now shows up in my ps loop looking for D state processes. So I have it narrowed down. Something is wrong with the storage on this VM, and it only shows up after 5000 containers are started (well, I am told it varies by a few thousand here and there).
This may seem like a tangent but I promise it is going somewhere:
Nearly two years ago, when we were first standing up openshift.com version 3 on AWS, we ran into a few eerily similar issues. I remember that our etcd cluster would suddenly start freaking out (that is a technical term). Leader elections, nodes going totally offline…And I remember working with our AWS contacts to figure it out. At the time it was a little less well-known, and today just by googling it appears fairly well understood. The issue with this reproducer turns out to be something called a BurstBalance. BurstBalance is AWS business logic interfering with all that is good and holy. If you purchase storage, you should be able to read and write from it, no?
As with all public cloud, you can do whatever you want…for a price. BurstBalance is the creation of folks who want you to get hooked on great performance (gp2 can run at 3000+ IOPS), but then when you start doing something more than dev/test and run into these weird issues, you’re already hooked and you have no choice but to pay more for a service that is actually usable. This model is seen throughout public cloud. For example, take the preemptible instances on GCE or the t2 instance family on AWS.
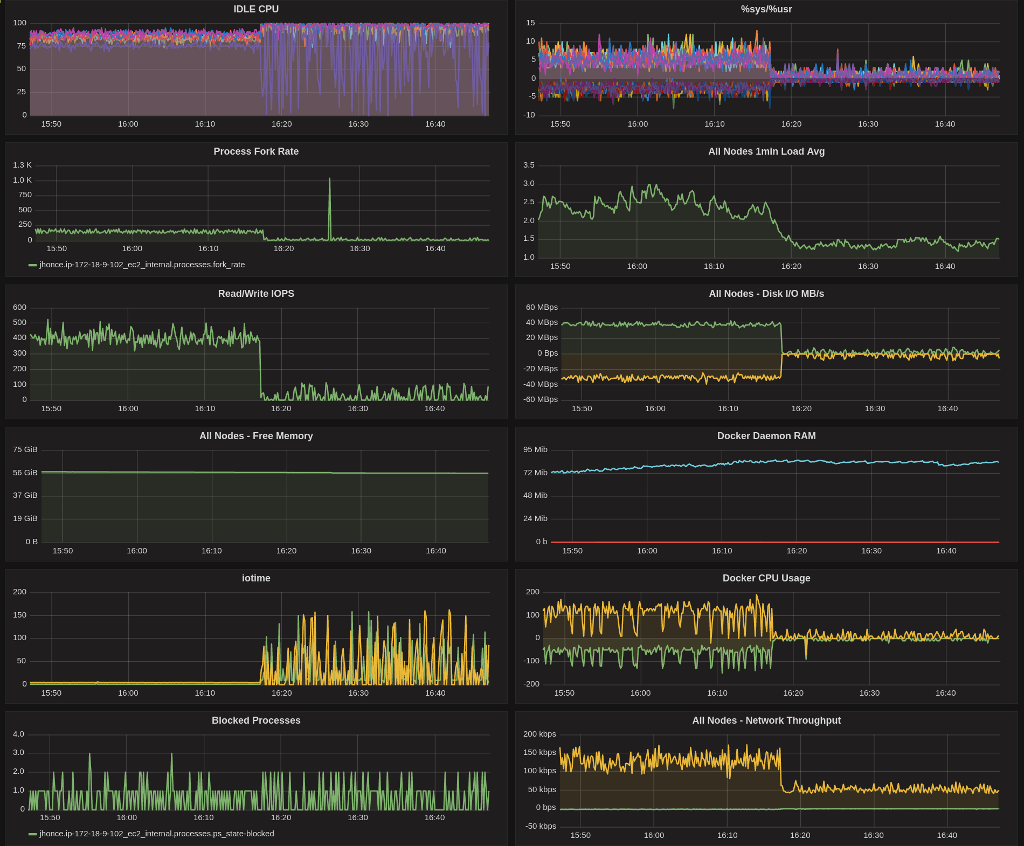
I have setup my little collectd->graphite->grafana dashboard that I use for this sort of thing. You can see things are humming along quite nicely for a while, and then…yeah.

Once the reproducer exhausts the gp2 volume’s BurstBalance, things go very, very badly. Why? Simple. Applications were not written to assume that storage would ever slow down like this. Issues in docker cascade back up the stack until finally a user complains that it took 5 minutes to start their pod.
The reason is that we have not paid our bounty to the cloud gods.

Here is BurstBalance and the magical AWS QoS/business logic in action.
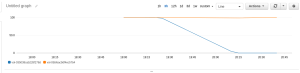
You can see it looks a lot like my grafana graphs…quota is exhausted, and the IOPS drop to a trickle.
What would happen then if we did kneel at the alter of Bezos and pay him his tithe? I will show you.
The reproducer is chugging along, until it slams into that magical AWS business logic. Some QoS system somewhere jumps for joy at the thought of earning even more money. This time, we will pay him his fee…for science.
You can see that our reproducer recovers (lower is better) once we flip the volume type to provisioned IOPS (io1)…this was done on the fly. We set the io1 volume to 1000 IOPS (mostly random choice…) which is why it is slightly higher after the recovery than it was before the issue occurred. gp2 can crank along really, really fast. That is, until…

The take aways from this debugging session are:
- Regardless of cloud provider, you pay a premium for both performance and determinism.
- If you think you are saving money up front, just wait until the production issues start rolling in which, conveniently, can easily be solved by simply clicking a little button and upgrading to the next tier. Actually, it is brilliant and I would do the same if I had the unicorn QoS system at my disposal, and was tasked with converting that QoS system into revenue.
- I now must proactively monitor BurstBalance and flip volumes to io1 instead of let them hit the wall in production. Monitoring for this (per AWS documentation, use CloudWatch)
is an additional fee appears to be included in their CloudWatch free tier.
- Perhaps we flip all volumes to io1 proactively and then flip them back when the critical period is over.
- One thing I ran out of time to verify is what happens to my BurstBalance if I flip to io1, then back to gp2? Is my BurstBalance reset? Probably not, but I haven’t done the leg work yet to verify.
- We will do less I/O when using overlay2 (might just delay the inevitable).
- All super critical things (like etcd) get io1 out of the gate. No funny business.