Going Full Send on my WFH A/V setup

I tried hard to make it work. But I could never get the results I wanted. The crisp video, clean audio, the BOKEH. Herein lies my adventures (full send, some might say) over the past ~2 months in getting a proper home office A/V setup. It’s not perfect yet, but I’m fairly happy with the improvement. I’ll close this write-up with some of my next steps / gaps.

Starting with some basic tenets:

  • Whatever I end up with has to augment all of my ingrained behaviors; I’m not going to relearn how to use a computer (change operating system) for the sake of this.
  • I’m stuck with the room I’ve got. The walls have odd angles which makes lighting difficult.
  • I don’t know anything about this, so there will be lots of trial, error, and Googling.

I started by scouring YouTube for videos about the ultimate camera setup for WFH. It turns out the center of knowledge in this area is Twitch streamers. There are also a few companies posting setups who are more business focused, feels like they’re using these videos to promote their consulting businesses (which are around video editing, or promoting small business). Twitch streamers also know a lot about Open Broadcaster Software, but I’ll get to that in a bit.

Camera

After seeing this blog come across my Twitter, I impulse-buy a GoPro Hero 8 Black. Turns out GoPro is completely ignoring Linux and their webcam firmware is really, really beta even on Mac and Windows. Returned it.

After watching a lot more of these videos, I started seeing a trend towards a particular Mirrorless DSLR camera, the Canon EOS M50. I’m trying to stay with models that folks recommend for WFH/streaming, and that I can find SOMETHING saying they support Linux / have anecdotal evidence of it working. So I bought a Canon M50. I had to buy it from a place I hadn’t shopped at before (Best Buy), because a lot of people are trying to up their WFH A/V game, making components scarce.

So I’ve got the camera. I also need a micro HDMI –> USB 3 cable, so I got one of those. Elsewhere in the YouTube blackhole, I came across the term “dummy battery”. This is a hollow battery that lets you plug the camera directly into wall power to avoid having to use real batteries and their runtime limitations. Canon dummy batteries were sold out everywhere, including Canon themselves, although I did place an order with them directly (their web purchasing experience is stuck in early 2000s). It was on backorder, so I eventually canceled that order and bought a knockoff dummy battery for 20% of the price of the real one. Was I worried that something 20% cheaper would instantly fry my camera? Yep. But I am in full send mode now.

So I have the camera, the HDMI cable, the dummy battery. I probably need a tripod, right? I think cameras need tripods. OK, I got a tripod. Not sure what I’ll use it for, but I can always return it. Turns out the tripod was a key investment in making sure the camera is stable, level and oriented properly for the right angle.

Next I probably need a memory card, right? Cameras need memory cards? OK, I’ll get a memory card. But which one? I’m planning to put down 4k video @ 60 fps so “sorting by least expensive” is probably not the right move. Turns out there is a whole disaster of categorization of memory card performance. I ended up reading, and re-reading this page a few times. What a nightmare. The least consumer-friendly thing since 802.11 spec naming. Anyway I ended up buying a 128GB class 10 card and it seems to be fine.

I then have to connect the camera to my computer. The videos suggest HDMI, but Canon has recently announced USB support for live-streaming. This blog in particular was referenced in a few videos. Lets try that. OK, now I am into the land of having to configure and load out of tree kernel modules. How do you do this again? It’s been a while. OK, got it. Whew. How badly do I want the BOKEH? This is getting dicey and doesn’t feel right.

Well, it actually works. But it is FAR from ideal. The fact that I’ve got to run gphoto2 on boot, and install all this goop to wire things together … there has to be a better way?

I began using this setup for the first time in real video calls (we use Google Meet where I work). The quality was infinitely improved (making sure my Meet config used 720p and after literally days of experimentation with camera settings). People immediately noticed the difference too. However, sometimes the camera would shut off? I noticed a trend of it shutting off after about a half hour? But I have the dummy battery. What’s going on?

I will spare you the suspense. If I’d found this page, I’d never have bought the Canon M50. It shuts off after a half hour on purpose. There’s no way around it. Also the Canon M50 is not compatible with Magic Lantern firmware. What is Magic Lantern? Something I don’t want to deal with. Gone are my days of CyanogenMod on my Palm Pre (by the way, the Palm Pre was better than any phone I’ve owned before or since, don’t @ me).

So, my Canon shuts off. That’s just about the worst flaw it could have. Back to Best Buy. But not before the 14 day return policy expires, so I can’t do it online, I now have to physically visit a Best Buy to haggle, or eBay it. Despite COVID situation, I decided to mask it and haggle. Luckily they took the camera back, yay. If you’re interested in why it turns off, I found this post which is probably right…yeesh!

Next, what camera should I go for? Elgato’s page made it super easy to find cameras of a similar price-point that didn’t have any glaring flaws.

After much more fact-checking, I decided to get a Sony A6100. This time Amazon had it in stock, and significantly cheaper than other sites (price gouging?). The Sony arrives and it is immediately more useful (because it doesn’t shut off). Incidentally, I had to buy a different dummy battery for the Sony. An off-brand, that has thus far not fried my camera. Tripod, memory card and HDMI cable were compatible.

Next, how to connect this to my computer. The Sony also supports USB, but I’m not happy with the quality. It also uses a lot of CPU. What solutions are there? After many a sleepless night on YouTube learning what a “capture card” is, I went to find the highest end model, and found an Elgato 4K60 PRO PCI capture card. Wow, this was a total waste of time. Not only does it have zero Linux support but it feels like Elgato is actively ignoring Linux across the board, which is possibly corroborated by my experience with their CamLink 4K as well(?). I end up searching my email for that phrase in case some other intrepid Red Hatter is further along than me.

It turns out that an engineer whom I hired ~4 years ago, and who I allegedly sit next to in the office (it’s been 6+ months, and I’m full sending my home office, maybe I’ll never see him again), wrote a post about capture cards in May 2020! I have learned to trust this person’s opinion on these sorts of niche devices, because he has described his enviable Plex setup (it has a dedicated air conditioner), his GPU bitcoin mining, Threadripper prowess, and other things to me over lunch which indicate he has a nack for understanding things at the level of detail that I need for my BOKEH. His post pointed to a Magewell USB Capture HDMI 4K Plus Device. In particular he had tested it on Fedora and noted how hands-off it was for setup. His complaint was noise about a built-in fan. After balking at the price, I decide that it can be returned, so I get one. It turns out he was right, and it works great! One thing though is that I haven’t heard the fan at all, which I guess is good. Thanks to Sebastian for this tip.

However its really expensive. And the YouTubers are telling me about Elgato CamLink 4k which is 1/3rd the price. I get a CamLink 4K and decide that if it works, I’ll return the Magewell to save the money. Hook up the CamLink, the kernel sees it as a uvc device, but I see nothing but a black screen in OBS and Google Meet. After an hours worth of effort and Google turning up several complaints on this topic (admittedly not a huge effort on my part), I decide to trade money for my weekends/evenings back, and stick with the Magewell. Sebastian was right again. Hat-tip.

Audio

On to Audio. Last year I hired an engineer who turned out to be in two metal bands. On video calls with him, he had what looked like a very serious A/V setup in his home office. If you’re into Dual-Violin US Folk Metal, maybe check them out. Anyway, this person gave me some guidance on audio and I ended up going with a Blue Yeti USB Mic. This is one aspect of this journey that worked on the first try. However I could not help but think maybe there’s a way to improve? At conferences, when they were in-person, presenters get a lavalier mic. I bought one and it wasn’t any better. Also it was annoying to have a cable dangling from my collar all day. Returned.

For years I’ve been using Bose active noise cancelling headphones (at the office which is an open-office disaster / cacophony). At home I also bought Bose ones, but the in-ear model. The only thing I don’t like is that they’re wired, so I’m tied to the desk. One thing I do like is that they’re wired, so I never have to worry about batteries like I do with the ones I have at the office. I also have a pair of noise cancelling Galaxy Buds (which I love). I decide to try those. Ahh, my workstation doesn’t have Bluetooth. Back to Amazon to get a cheap bluetooth dongle. And now the Galaxy Buds work. But the experience sucks, for a few reasons:

  • I have to worry about batteries
  • They disconnect if I walk down the hall
  • Pairing is less than ideal in Linux where I have ~5 audio devices
  • I notice a lot of CPU usage tied back to the Bluetooth device…not good.
  • I decide not to die on this hill, and stick with the Bose QuietComfort 20.

I have the Video and Audio basically squared away at this point. What’s next? Lighting.

Lighting

The majority if howto videos indicate that if you don’t have proper lightning, it won’t matter your camera or software. I begin to research lighting, and found that Elgato Key Lights are a popular thing. You apparantly need two of them, they’re $200 each, and they’re out of stock. So, nope. I have a spare floor lamp and decide to use that. This is much better than the ceiling fan light I had which was casting a very scary shadow on my face 🙂 So the lamp is to my east-south-east, pointed towards the ceiling and I’m OK with the results. This is an area I may eventually want to improve, but maybe I’m nearing diminishing returns time-wise?

Software

Conferences have gone virtual, and I have several presentations lined up, which are all typically recorded. So now I need to figure out how to record myself. According to YouTubers, I need to figure out what OBS stands for. The Open Broadcaster Software is (apparently) an open source streaming/recording application available for Windows, Mac and Linux. I am now watching EposVox masterclass on OBS. It’s complicated but not terrible to do basic stuff. You can see my first stab at integrating my efforts into a recorded presentation here.

After watching that video back, I have a few areas to improve:

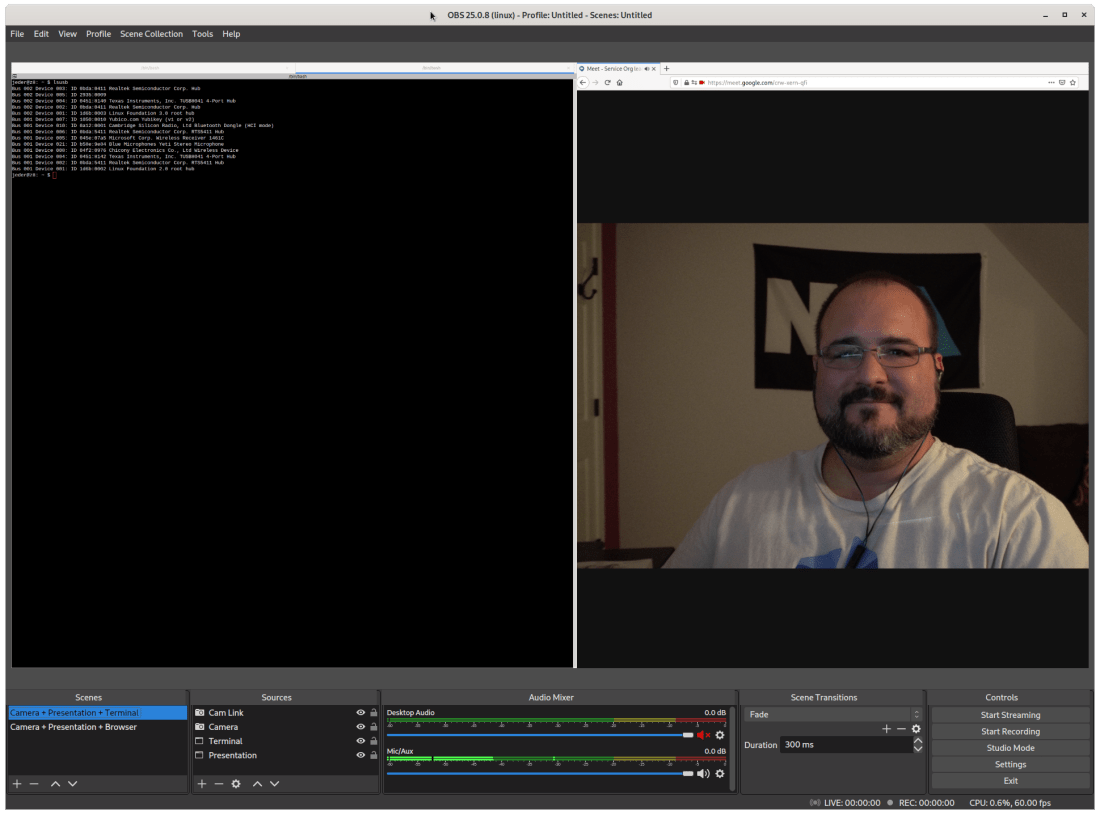
  • I keep having to pause the recording to load the next section of content into my brain. I have to keep looking down to pause. There are apparently things called Elgato Stream Decks, which are a pad of hotkeys which are used by game streamers to automate certain operating system or OBS operations. OBS also supports hotkeys. Here is what my OBS canvas looks like including a few video sources and scenes:
  • I am not looking into the camera often enough. Yes, I have to look at my monitor to do demos and whatnot (expected), but I am also looking at my monitor to check my notes. I want to avoid that somehow. It turns out that Phone-based Teleprompters are a thing, and in-expensive. I bought one. It’s freaking cool. Mounts directly to the camera lens and displays the “script” overlaying the lens itself. So you are staring directly at the lens, and have a “Star Wars intro” style scrolling text of your content. Cannot recommend this product enough for professional delivery of recorded content. It even comes with a Bluetooth remote to control scrolling speed and start/stop. That dongle comes in handy again!
  • I want to involve whiteboards in my presentations. In the office, I have whiteboards available to me everywhere. I need one at home. But due to the size and shape of my office, I really don’t have a wall within camera-range to mount one. So I went with one on wheels. I haven’t used it in any presentations yet, but I’ve been using it for keeping notes and so far loving it.
  • I have to learn how to do basic video editing. After some Googling for the state of the art on Linux, I found Kdenlive which isn’t terrible to learn, after watching a few beginners videos.
  • I realize the audio is out of sync with the video. OBS let me insert a delay to help match then up. 300ms seems to be perfect.
  • In the original version of this video, the audio was super low. So I had to learn how to convert an mkv (OBS default) to an mp4, so I can work with the audio independently of the video, and boost the audio gain (by +20dB if you’re curious). Thanks to some quick tips from Langdon White I am able to achieve this. At this point my various experiments and YouTube deep dives are starting to pay off. I am smiling, finally 🙂


Next Steps

  • For some reason, when I turn off the camera, the zoom level resets to 16mm. But I want it at 18mm. So every time I turn the camera power on, I have to dial the zoom back in manually. Not a huge deal since it’s just once a day.
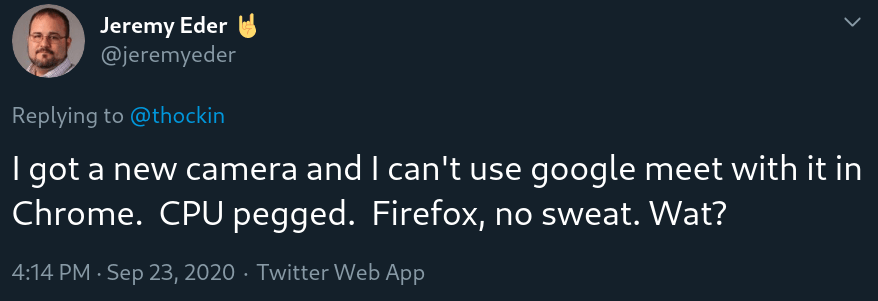
  • CPU usage in Chrome…brings the computer to a crawl. My workstation has 16 cores and 64G RAM. Sigh…so now all my Google Meets occur in Firefox. Not too bad, just annoying when it comes to screensharing since I really do not want to use Firefox as my primary browser.
  • Lens: according to photography snobs, if I don’t get a better lens, they’ll throw me out of the subreddit. This will probably have to wait until after my winning lotto ticket shows up.
  • After talking with some coworkers who are also upleveling their WFH A/V setups and thus learning what OBS stands for, I come to find out that OBS has some noise filtering options built in. I could have used that to filter out some background noise (e.g. from my kids or my workstation fans).

Conclusion / Final Hardware list

So, in the end, my hardware and software setup as of this posting is:

I have to say, this has been a really fun project. It’s an area I had zero knowledge of going in – just a personal goal to improve my WFH A/V. It’s also an area of somewhat daunting complexity, hardware opinions (nerd fights), and an endless compatibility matrix. That’s part of why I went the route of buying stuff and returning it [1].

I hope this post helps someone who is looking to improve their home office video quality avoid newb mistakes and just get it done. Also, I do realize that there are likely cheaper options across the board. But at least you have the laundry list of stuff that worked for me, within my given constraints, and can possibly phase your purchases like I did over a couple months.

[1] always check the return policy 🙂

List of Useful YouTube Channels


Docker operations slowing down on AWS (this time it’s not DNS)

I’m CC’d on mails when things get slow, but never when things work as expected or are fast…oh well.  Like an umpire in baseball, if we are doing our jobs, we are invisible.

Subject:  Docker operations slowing down

I reach for my trusty haiku for this type of thing:

Ah but in this scenario, it is something more…sinister (my word).  What could be more sinister than DNS, you say?  It’s the magical QoS system by which a cloud provider creatively rents you resources.  The system that allows for any hand-wavy repackaging of compute or network or disk into a brand new tier of service…

Platinum.  No, super Platinum.  What’s higher than platinum?  Who cares, we are printing money and customers love us because we have broken through their antiquated finance process.  We will gladly overpay via OpEx just to avoid that circus.

But I digress…

In this scenario, I was working with one of our container teams folks who had a report of CI jobs failing and someone had debugged a bit and pinned the blame on docker.  I watch the reproducer run.  It is running

docker run --rm fedora date

in a tight loop.  I watch as docker daemon gets through its 5000th loop iteration, and…still good to go.  On average, ~3 seconds to start a container and delete it.  Not too bad, certainly not something that a CI job shouldn’t be able to handle.  I continue to stare at tmux and then it happens…WHAM! 82 seconds to start the last container.  Ahh, good.  Getting a reproducer is almost always the hardest part of the process.  Once we have a tight debug loop, smart people can figure things out relatively quickly.

I am looking at top in another window, and I see systemd-udev at the top of the list…what the…

As much as I would love to blame DNS for this, I have a hunch this is storage related now, because the reproducer shouldn’t be doing anything on the network.  Now I am running ps in a loop and grepping for ” D “.  Why?  Because that is the process state when a thread is waiting on I/O.  I know this because of several terribly painful debugging efforts with multipath in 2010.  Looking back, it may have been those situations that have made me run screaming from filesystem and disk performance issues ever since 🙂

From man ps:

PROCESS STATE CODES
 Here are the different values that the s, stat and state output specifiers (header "STAT" or "S") will display to describe the state of a process:

 D uninterruptible sleep (usually IO)
 R running or runnable (on run queue)
 S interruptible sleep (waiting for an event to complete)
 T stopped by job control signal
 t stopped by debugger during the tracing
 W paging (not valid since the 2.6.xx kernel)
 X dead (should never be seen)
 Z defunct ("zombie") process, terminated but not reaped by its parent

Normally, processes oscillate between R and S, often imperceptibly (well, at least not something you see very often in top).  You can easily trace this with the systemtap script sleepingBeauties.stp if you really need to.  This script will print a backtrace of any thread that enters D state for a configurable amount of time.

Anyway here are the threads that are in D state.

root 426 0.4 0.0 0 0 ? D 16:10 0:08 [kworker/7:0]
root 5298 0.2 0.0 47132 3916 ? D 16:39 0:00 /usr/lib/systemd/systemd-udevd
root 5668 0.0 0.0 47132 3496 ? D 16:40 0:00 /usr/lib/systemd/systemd-udevd
root 24112 0.5 0.0 0 0 ? D 16:13 0:08 [kworker/u30:0]
root 5668 0.0 0.0 47132 3832 ? D 16:40 0:00 /usr/lib/systemd/systemd-udevd
root 5656 0.0 0.0 47132 3884 ? D 16:39 0:00 /usr/lib/systemd/systemd-udevd
root 29884 1.1 0.0 0 0 ? D 15:45 0:37 [kworker/u30:2]
root 5888 0.0 0.0 47132 3884 ? D 16:40 0:00 /usr/lib/systemd/systemd-udevd
root 5888 0.5 0.0 47132 3904 ? D 16:40 0:00 /usr/lib/systemd/systemd-udevd
root 5964 0.0 0.0 47132 3816 ? D 16:40 0:00 /usr/lib/systemd/systemd-udevd
root 29884 1.1 0.0 0 0 ? D 15:45 0:37 [kworker/u30:2]
root 5964 0.3 0.0 47132 3916 ? D 16:40 0:00 /usr/lib/systemd/systemd-udevd
root 5964 0.2 0.0 47132 3916 ? D 16:40 0:00 /usr/lib/systemd/systemd-udevd
root 24112 0.5 0.0 0 0 ? D 16:13 0:08 [kworker/u30:0]

That is interesting to me.  udevd is in the kernel’s path for allocate/de-allocate storage devices.  I am now convinced it is storage.  kworker is a workqueue kernel thread that fires when the kernel’s writeback watermarks (dirty pages) are hit.  For my extreme low latency work, I documented how to shove these in a corner in my Low Latency Tuning Guide for Red Hat Enterprise Linux 7.

I move over to another tmux pane and I try:

dd if=/dev/zero of=/root/50MB bs=1M count=10 oflag=sync

I know that if this does not complete in < 5 seconds, something is terribly hosed.  Aaaaaand it hangs.  This process now shows up in my ps loop looking for D state processes.  So I have it narrowed down.  Something is wrong with the storage on this VM, and it only shows up after 5000 containers are started (well, I am told it varies by a few thousand here and there).

This may seem like a tangent but I promise it is going somewhere:

Nearly two years ago, when we were first standing up openshift.com version 3 on AWS, we ran into a few eerily similar issues.  I remember that our etcd cluster would suddenly start freaking out (that is a technical term).  Leader elections, nodes going totally offline…And I remember working with our AWS contacts to figure it out.  At the time it was a little less well-known, and today just by googling it appears fairly well understood.  The issue with this reproducer turns out to be something called a BurstBalance.  BurstBalance is AWS business logic interfering with all that is good and holy.  If you purchase storage, you should be able to read and write from it, no?

As with all public cloud, you can do whatever you want…for a price.  BurstBalance is the creation of folks who want you to get hooked on great performance (gp2 can run at 3000+ IOPS), but then when you start doing something more than dev/test and run into these weird issues, you’re already hooked and you have no choice but to pay more for a service that is actually usable.  This model is seen throughout public cloud.  For example, take the preemptible instances on GCE or the t2 instance family on AWS.

I have setup my little collectd->graphite->grafana dashboard that I use for this sort of thing.  You can see things are humming along quite nicely for a while, and then…yeah.

Once the reproducer exhausts the gp2 volume’s BurstBalance, things go very, very badly.  Why?  Simple.  Applications were not written to assume that storage would ever slow down like this.  Issues in docker cascade back up the stack until finally a user complains that it took 5 minutes to start their pod.

The reason is that we have not paid our bounty to the cloud gods.

Here is BurstBalance and the magical AWS QoS/business logic in action.

You can see it looks a lot like my grafana graphs…quota is exhausted, and the IOPS drop to a trickle.

What would happen then if we did kneel at the alter of Bezos and pay him his tithe?  I will show you.

The reproducer is chugging along, until it slams into that magical AWS business logic.  Some QoS system somewhere jumps for joy at the thought of earning even more money.  This time, we will pay him his fee…for science.

You can see that our reproducer recovers (lower is better) once we flip the volume type to provisioned IOPS (io1)…this was done on the fly.  We set the io1 volume to 1000 IOPS (mostly random choice…) which is why it is slightly higher after the recovery than it was before the issue occurred.  gp2 can crank along really, really fast.  That is, until…


The take aways from this debugging session are:

  • Regardless of cloud provider, you pay a premium for both performance and determinism.
  • If you think you are saving money up front, just wait until the production issues start rolling in which, conveniently, can easily be solved by simply clicking a little button and upgrading to the next tier.  Actually, it is brilliant and I would do the same if I had the unicorn QoS system at my disposal, and was tasked with converting that QoS system into revenue.
  • I now must proactively monitor BurstBalance and flip volumes to io1 instead of let them hit the wall in production. Monitoring for this (per AWS documentation, use CloudWatch) is an additional fee appears to be included in their CloudWatch free tier.
  • Perhaps we flip all volumes to io1 proactively and then flip them back when the critical period is over.
  • One thing I ran out of time to verify is what happens to my BurstBalance if I flip to io1, then back to gp2?  Is my BurstBalance reset?  Probably not, but I haven’t done the leg work yet to verify.
  • We will do less I/O when using overlay2 (might just delay the inevitable).
  • All super critical things (like etcd) get io1 out of the gate.  No funny business.


Juggling backing disks for docker on RHEL7, using atomic storage migrate

Quick article on how to use the atomic storage commands to swap out an underlying6852258 storage device used for docker’s graph storage.

  • I am currently using overlay2 for docker storage, and /var/lib/docker is currently on my root partition :-/
  • I want to add a 2nd disk just for docker storage.
  • I want to keep my images, rather than have to download them again.

I have a few images in my system:

# docker images
 REPOSITORY TAG IMAGE ID CREATED SIZE
 docker.io/openshift/hello-openshift latest 305f93951299 3 weeks ago 5.635 MB
 docker.io/centos centos7 3bee3060bfc8 6 weeks ago 192.6 MB
 docker.io/monitoringartist/grafana-xxl latest 5a73d8e5f278 10 weeks ago 393.4 MB
 docker.io/fedora latest 4daa661b467f 3 months ago 230.6 MB
 docker.io/jeremyeder/c7perf latest 3bb51319f973 4 months ago 1.445 GB
 brew-pulp-docker01.redacted.redhat.com:8888/rhel7/rhel-tools latest 264d7d025911 4 months ago 1.488 GB
 brew-pulp-docker01.redacted.redhat.com:8888/rhel7 latest 41a4953dbf95 4 months ago 192.5 MB
 docker.io/busybox latest 7968321274dc 6 months ago 1.11 MB
 # df -h
 Filesystem Size Used Avail Use% Mounted on
 /dev/mapper/vg0-root 193G 162G 23G 88% /
 devtmpfs 16G 0 16G 0% /dev
 tmpfs 16G 0 16G 0% /dev/shm
 tmpfs 16G 804K 16G 1% /run
 tmpfs 16G 0 16G 0% /sys/fs/cgroup
 /dev/vdc1 100G 33M 100G 1% /var/lib/docker/overlay
 /dev/vda1 2.0G 549M 1.5G 28% /boot

All of docker’s storage right now consumes about 4GB.  It’s important to verify this because the migrate commands we’re about to walk through require this much space to complete the migration:

# du -hs /var/lib/docker
 3.9G /var/lib/docker

By default, the atomic migrate commands will write to /var/lib/atomic, so whatever filesystem holds that directory will need at least (in my case) 4GB free.

The migration process has several phases:

  1. Export any containers and images.
  2. Allow user to adjust storage on the system.
  3. Allow user to adjust storage configuration of docker.
  4. Import containers and images back into the new docker graph storage.

I’m using a VM with spinning disks so this takes a little longer than it otherwise might, but let’s start the export:

# time atomic storage export
 Exporting image: 5a73d8e5f278
 Exporting image: 3bb51319f973
 Exporting image: 7968321274dc
 Exporting image: 3bee3060bfc8
 Exporting image: 4daa661b467f
 Exporting image: 264d7d025911
 Exporting image: 41a4953dbf95
 Exporting image: 305f93951299
 Exporting volumes
 atomic export completed successfully

real 1m57.159s
 user 0m1.094s
 sys 0m6.190s

OK that went oddly smoothly, let’s see what it actually did:

# find /var/lib/atomic/migrate
 /var/lib/atomic/migrate
 /var/lib/atomic/migrate/info.txt
 /var/lib/atomic/migrate/containers
 /var/lib/atomic/migrate/images
 /var/lib/atomic/migrate/images/4daa661b467f23f983163d75f0b87744cd3d88a2aed11be813d802606e8f13df
 /var/lib/atomic/migrate/images/3bee3060bfc81c061ce7069df35ce090593bda584d4ef464bc0f38086c11371d
 /var/lib/atomic/migrate/images/7968321274dc6b6171697c33df7815310468e694ac5be0ec03ff053bb135e768
 /var/lib/atomic/migrate/images/264d7d0259119cf980fb95759865938765ccb3f1aa24600cbac49bea6b5b8cfb
 /var/lib/atomic/migrate/images/305f939512995147aa964bceef36a4a83226fae523c52b011fd69c9a229e3460
 /var/lib/atomic/migrate/images/5a73d8e5f27861df210b03ca872530b6ab8b20b6a0d9c815022da3e0812df089
 /var/lib/atomic/migrate/images/3bb51319f9734038d7b2d3c67cae6c25bbd9df18163cd7810ffcff952cbe0608
 /var/lib/atomic/migrate/images/41a4953dbf957cfc562935239a3153a5da6101f32fa30da7b4a506f23cfcde9d
 /var/lib/atomic/migrate/volumes
 /var/lib/atomic/migrate/volumes/volumeData.tar.gz

Seems reasonable…incidentally that info.txt just includes the name of the storage driver used at the time migrate was executed.

# du -hs /var/lib/atomic
3.8G /var/lib/atomic

OK let’s do the deed:

# atomic storage reset
 Docker daemon must be stopped before resetting storage

Oh, I guess that would make sense.

# systemctl stop docker
# atomic storage reset

OK, at this point /etc/sysconfig/docker-storage is reset to it’s default state, and I have nothing in my docker graph storage.

Because I want to continue to use overlay2, I will use the atomic storage modify command to make that so:

# atomic storage modify --driver overlay2
# cat /etc/sysconfig/docker-storage
 DOCKER_STORAGE_OPTIONS="--storage-driver overlay2 "

Things are looking good so far.

Now about adding more storage.

  • I have added a new virtual storage device to my VM called /dev/vdc1
  • I have partitioned and formatted it with XFS filesystem.
  • I have mounted it at /var/lib/docker and setup an fstab entry.
# lsblk
 NAME MAJ:MIN RM SIZE RO TYPE MOUNTPOINT
 vda 252:0 0 200G 0 disk
 ├─vda1 252:1 0 2G 0 part /boot
 └─vda2 252:2 0 198G 0 part
 ├─vg0-swap 253:0 0 2G 0 lvm [SWAP]
 └─vg0-root 253:1 0 196.1G 0 lvm /
 vdb 252:16 0 100G 0 disk
 └─vdb1 252:17 0 100G 0 part
 vdc 252:32 0 100G 0 disk
 └─vdc1 252:33 0 100G 0 part /var/lib/docker

At this point we are ready to restart docker and import the images from my previous storage.  First let me verify that it’s OK.

# systemctl start docker
# docker info|grep -i overlay2
 Storage Driver: overlay2

Cool, so docker started up correctly and it has the overlay2 storage driver that I told it to use with the atomic storage modify command (from previous step).

Now for the import…

# time atomic storage import
 Importing image: 4daa661b467f
 ae934834014c: Loading layer [==================================================>] 240.3 MB/240.3 MB
 Loaded image: docker.io/fedora:latest
 Importing image: 3bee3060bfc8
 dc1e2dcdc7b6: Loading layer [==================================================>] 200.2 MB/200.2 MB
 Loaded image: docker.io/centos:centos7
 Importing image: 7968321274dc
 38ac8d0f5bb3: Loading layer [==================================================>] 1.312 MB/1.312 MB
 Loaded image: docker.io/busybox:latest
 Importing image: 264d7d025911
 827264d42df6: Loading layer [==================================================>] 202.3 MB/202.3 MB
 9ca8c628d8e7: Loading layer [==================================================>] 10.24 kB/10.24 kB
 a03f55f719da: Loading layer [==================================================>] 1.336 GB/1.336 GB
 Loaded image: brew-pulp-docker01.redacted.redhat.com:8888/rhel7/rhel-tools:latest
 Importing image: 305f93951299
 5f70bf18a086: Loading layer [==================================================>] 1.024 kB/1.024 kB
 c618fb2630cb: Loading layer [==================================================>] 5.637 MB/5.637 MB
 Loaded image: docker.io/openshift/hello-openshift:latest
 Importing image: 5a73d8e5f278
 8d4d1ab5ff74: Loading layer [==================================================>] 129.4 MB/129.4 MB
 405d1c3227e0: Loading layer [==================================================>] 3.072 kB/3.072 kB
 048845c41855: Loading layer [==================================================>] 277.2 MB/277.2 MB
 Loaded image: docker.io/monitoringartist/grafana-xxl:latest
 Importing image: 3bb51319f973
 34e7b85d83e4: Loading layer [==================================================>] 199.9 MB/199.9 MB
 ab7578fbc6c6: Loading layer [==================================================>] 3.072 kB/3.072 kB
 3e89505f5573: Loading layer [==================================================>] 58.92 MB/58.92 MB
 753668c55633: Loading layer [==================================================>] 1.169 GB/1.169 GB
 d778d7335b8f: Loading layer [==================================================>] 11.98 MB/11.98 MB
 5cd21edffb34: Loading layer [==================================================>] 45.1 MB/45.1 MB
 Loaded image: docker.io/jeremyeder/c7perf:latest
 Importing image: 41a4953dbf95
 Loaded image: brew-pulp-docker01.redacted.redhat.com:8888/rhel7:latest
 Importing volumes
 atomic import completed successfully
 Would you like to cleanup (rm -rf /var/lib/atomic/migrate) the temporary directory [y/N]n
 Please restart docker daemon for the changes to take effect

 real 1m23.951s
 user 0m1.391s
 sys 0m4.095s

Again went smoothly.  I opted not to have it automatically clean up /var/lib/atomic/migrate automatically because I want to verify a thing or two first.

Let’s see what’s on my new disk:

# df -h /var/lib/docker
Filesystem Size Used Avail Use% Mounted on
/dev/vdc1 100G 3.9G 97G 4% /var/lib/docker

OK that looks reasonable.  Let’s start docker and see if things imported correctly:

# systemctl restart docker

# docker images
 REPOSITORY TAG IMAGE ID CREATED SIZE
 docker.io/openshift/hello-openshift latest 305f93951299 3 weeks ago 5.635 MB
 docker.io/centos centos7 3bee3060bfc8 6 weeks ago 192.6 MB
 docker.io/monitoringartist/grafana-xxl latest 5a73d8e5f278 10 weeks ago 393.4 MB
 docker.io/fedora latest 4daa661b467f 3 months ago 230.6 MB
 docker.io/jeremyeder/c7perf latest 3bb51319f973 4 months ago 1.445 GB
 brew-pulp-docker01.redacted.redhat.com:8888/rhel7/rhel-tools latest 264d7d025911 4 months ago 1.488 GB
 brew-pulp-docker01.redacted.redhat.com:8888/rhel7 latest 41a4953dbf95 4 months ago 192.5 MB
 docker.io/busybox latest 7968321274dc 6 months ago 1.11 MB

Images are there.  Can I run one?

# docker run --rm fedora pwd
/

Indeed I can.  All seems well.

This utility is very handy in scenarios where you want to do some surgery on the backend storage, but do not want to throw away/download images and containers.  I could envision using this utility when

  • Moving from one graph driver to another.  Note that we have SELinux support coming to overlay2 in RHEL 7.4.
  • Perhaps you have a lot of images or containers and slow internet.

Either way, this process was about as smooth as it could be…and a very clean UX, too.

nsinit: per-container resource monitoring of Docker containers on RHEL/Fedora

The use-case for per-application resource counters

Administrators of *NIX-based systems are quite accustomed to viewing resource counters strewn throughout the system, in places like /proc, /sys and more recently /cgroup or /sys/fs/cgroup.  With the release of RHEL6 came widespread enterprise adoption of Control Groups (cgroups), which had been implemented steadily over a series of years, and vetted both there as well as in Fedora (RHEL’s upstream).

Implementing cgroups not only let sysadmins carve up a single OS into multiple logical partitions, it also bought them per-cgroup counters that the kernel maintains.  That’s in addition to common use-cases such as quality of service guarantees or charge-back.

Docker’s unique twist

With the recent uptick in adoption of Linux containers (Docker encapsulates several mature technologies into an impressive usability package), administrators might be wondering where the per-container resource counters are.  We’re in luck!  Since Docker heavily relies on Cgroups, many of the counters that sysadmins are familiar with “just work”.  They could benefit from some usability improvements, but if you’re comfortable spelunking through the cgroup VFS, you can dig them out fairly easily.

I should note that the specific hierarchy and commands below are specific to RHEL and Fedora, so you might have to customize some paths or package names for your system.

In the most recent versions of Fedora, engineers have begun building and shipping a binary called ‘nsinit‘, which is part of libcontainer, which is the “execution driver” for Docker.  nsinit is a very powerful debugging utility that lets sysadmins not only view per-container resource counters, but also view the container’s runtime configuration and “jump into” a running container.

How to use the nsinit utility

First you should grab a copy from Fedora, or build it yourself.  Building it yourself is an unnecessarily complicated exercise; so I’m glad they started building it for Fedora so you can just do:

# yum install --enablerepo=updates-testing golang-github-docker-libcontainer

$ rpm -qf `which nsinit`
golang-github-docker-libcontainer-1.1.0-7.git29363e2.fc20.x86_64

# nsinit
NAME:
 nsinit - A new cli application

USAGE:
 nsinit [global options] command [command options] [arguments...]

VERSION:
 0.1

COMMANDS:
 exec execute a new command inside a container
 init runs the init process inside the namespace
 stats display statistics for the container
 config display the container configuration
 nsenter init process for entering an existing namespace
 pause pause the container's processes
 unpause unpause the container's processes
 help, h Shows a list of commands or help for one command

I’ll cover the most useful of nsinit’s capabilities; config, stats and exec.

Note:  nsinit currently requires that you run it while you're inside the container's state directory.  So from here on, all commands assume you're in there.

So, something like this:

# docker ps -q
4caad549289

# CID=`docker ps -q`
# cd /var/lib/docker/execdriver/native/$CID*
# ll
total 8
-rw-r-xr-x. 1 root root 3826 Sep  1 20:11 container.json
-rw-r--r--. 1 root root  114 Sep  1 20:11 state.json

Those files are plain-text readable, although not very human-readable.  nsinit pretty-prints these files.  For example, an abridged verison of the output of nsinit config (full version here).  Note that you can get much of this info (but not all) from docker inspect.

# nsinit config

{
 "mount_config": {
 "mounts": [
 {
 "type": "bind",
 "source": "/var/lib/docker/init/dockerinit-1.1.1",
 "destination": "/.dockerinit",
 "private": true
 },
 {
 "type": "bind",
 "source": "/etc/resolv.conf",
 "destination": "/etc/resolv.conf",
 "private": true
 },
<snip>
 "mount_label": "system_u:object_r:svirt_sandbox_file_t:s0:c631,c744"
 },
 "hostname": "4caad5492898",
 "environment": [
 "HOME=/",
 "PATH=/usr/local/sbin:/usr/local/bin:/usr/sbin:/usr/bin:/sbin:/bin:/goroot/bin:/gopath/bin",
 "HOSTNAME=4caad5492898",
 "DEBIAN_FRONTEND=noninteractive",
 "GOROOT=/goroot",
 "GOPATH=/gopath"
 ],
 "namespaces": {
 "NEWIPC": true,
 "NEWNET": true,
 "NEWNS": true,
 "NEWPID": true,
 "NEWUTS": true
 },
 "capabilities": [
 "CHOWN",
 "DAC_OVERRIDE",
 "FOWNER",
 "MKNOD",
 "NET_RAW",
 "SETGID",
 "SETUID",
 "SETFCAP",
 "SETPCAP",
 "NET_BIND_SERVICE",
 "SYS_CHROOT",
 "KILL"
 ],
 "networks": [
 {
 "type": "loopback",
 "address": "127.0.0.1/0",
 "gateway": "localhost",
 "mtu": 1500
 },
 {
 "type": "veth",
 "bridge": "docker0",
 "veth_prefix": "veth",
 "address": "172.17.0.6/16",
 "gateway": "172.17.42.1",
 "mtu": 1500
 }
 ],
 "cgroups": {
 "name": "4caad5492898f1a4230353de15e2acfc05809c69d05ec7289c6a14ef6d57b195",
 "parent": "docker",
 "allowed_devices": [
<snip>
 "process_label": "system_u:system_r:svirt_lxc_net_t:s0:c631,c744",
 "restrict_sys": true
}

The stats mode is far more interesting.  nsinit reads cgroup counters for CPU and memory usage.  The network statistics come from /sys/class/net/<EthInterface>/statistics.  From here you can see how much memory your application is using, chart it’s growth, watch CPU utilization, cross-check data from other tools, etc.

{
 "network_stats": {
 "rx_bytes": 180568,
 "rx_packets": 89,
 "tx_bytes": 28316,
 "tx_packets": 92
 },
 "cgroup_stats": {
 "cpu_stats": {
 "cpu_usage": {
 "total_usage": 985559718,
 "percpu_usage": [
 43613750,
 79789656,
 132486590,
 78759739,
 49063680,
 60703059,
 36277458,
 35919550,
 36329424,
 20096103,
 8148695,
 25279255,
 0,
 0,
 0,
 6144761,
 14814784,
 2612915,
 95162480,
 33853872,
 114861235,
 71115914,
 6533416,
 33993382
 ],
 "usage_in_kernelmode": 510000000,
 "usage_in_usermode": 440000000
 },
 "throlling_data": {}
 },
 "memory_stats": {
 "usage": 27992064,
 "max_usage": 29020160,
 "stats": {
 "active_anon": 4411392,
 "active_file": 3149824,
 "cache": 22278144,
 "hierarchical_memory_limit": 9223372036854775807,
 "hierarchical_memsw_limit": 9223372036854775807,
 "inactive_anon": 0,
 "inactive_file": 19128320,
 "mapped_file": 3723264,
 "pgfault": 94783,
 "pgmajfault": 25,
 "pgpgin": 19919,
 "pgpgout": 13902,
 "rss": 4460544,
 "rss_huge": 2097152,
 "swap": 0,
 "total_active_anon": 4411392,
 "total_active_file": 3149824,
 "total_cache": 22278144,
 "total_inactive_anon": 0,
 "total_inactive_file": 19128320,
 "total_mapped_file": 3723264,
 "total_pgfault": 94783,
 "total_pgmajfault": 25,
 "total_pgpgin": 19919,
 "total_pgpgout": 13902,
 "total_rss": 4460544,
 "total_rss_huge": 2097152,
 "total_swap": 0,
 "total_unevictable": 0,
 "unevictable": 0
 },
 "failcnt": 0
 },
 "blkio_stats": {}
 }
}

nsenter is commonly used to run a command inside an existing container, something like

# nsenter -m -u -n -i -p -t 19119 bash

Where 19119 is the PID of a process in the container.  Ugly.  nsinit makes this slightly easier (at least IMHO):

# nsinit exec cat /etc/hostname
4caad549289
# nsinit exec bash
bash-4.2# exit

nsinit’s capabilities and reported statistics are incredibly useful when debugging the implementation of QoS for each container, implementing/verifying resource-ceilings/guarantees, and for a more complete understanding of what your containers are doing.

This area is fast-moving…I did want to call out two other important developments, which should ultimately have more broad applicability than nsinit.

Google has published a project called cAdvisor that provides a basic web interface, but more importantly an API for higher layers (such as Kubernetes) to use.

Red Hat has proposed container support for Performance Co-Pilot, a system-level performance monitoring utility in RHEL7, along with goals of teaching many other tools about containers.

Using SCHED_FIFO in Docker containers on RHEL

Well, I’ve been asked about this quite a few times now, so I figured a blog post was in order…

When I was trying to get cyclictest running in a container, I ran into a little snag. I couldn’t run realtime prio tasks inside a container by default. I checked all the normal ulimit stuff for RT, but no dice.  But I did find a way (ugly).

If you do want to run SCHED_FIFO tasks you can in fact do so, like this:

Run a privileged container (because of cap_sys_nice being dropped by docker) adding this to your docker run command:

--priveleged

Or, if you  have a more recent version of Docker, add this to your docker run command:

--cap-add=sys_nice

Set rt_runtime_us > 0 for the parent cgroup of where docker containers end up in the heirarchy:

# echo 950000 > /sys/fs/cgroup/cpu/system.slice/cpu.rt_runtime_us

Still blocked:

# docker run -it cyclictest bash
root@231fbb116315: ~ # chrt -f 1 w
chrt: failed to set pid 0's policy: Operation not permitted

3. Update cpu.rt_runtime_us for the new container:

# echo 900000 > `find /sys/fs/cgroup/cpu/system.slice|grep docker|grep scope|grep cpu.rt_runtime_us`

Now it works:

root@231fbb116315: ~ # chrt -f 1 w
11:01:56 up 26 min, 0 users, load average: 0.08, 0.05, 0.05
USER TTY LOGIN@ IDLE JCPU PCPU WHAT

Yes, it should be made easier…the question is at what level do we integrate this; Docker or orchestration.

For more info, see this Red Hat Bugzilla.

Getting Started with Performance Analysis of Docker

Docker introduces some intriguing usability, packaging and deployment patterns.  These new patterns offer the potential to effect massive improvements to the enterprise application development and operations specialties.  Containers also offer the promise of bare metal performance while offering some amount of isolation as well.  But can they deliver on that promise ?

Since the early part of January, the Performance Engineering Group at Red Hat has run huge amounts of microbenchmarks, benchmarks and application workloads in Docker containers.  The output of that effort has been a steady stream of lessons learned and advice/guidance given to our product architects and developers.  How dense can we go ?  How fast can it go ?  Are these defaults “sane” ?  What NOT to do…etc.

Disclaimer:  as anyone who has worked with Docker knows, it’s a project under heavy development.  I mention that because this blog post includes code snippets and observations that are tied to specific experiments and Docker/kernel versions.  YMMV, the answer of course is “it depends”, and so on.

Performance tests we’ve pointed at Docker containers

We’ve done a whole bunch of R&D testing with bleeding edge, “niche” hardware and software to push and pull Docker containers in completely unnatural ways.   Based on our choice of benchmarks, you can see that the initial approach was to calculate the precise overhead of containers as compared to bare metal (Red Hat’s Project Atomic will support bare metal deployment of containers).  Of course we are also gathering numbers with VMs to compare and containers in VMs (which might be the end-game, who knows…) via OpenStack etc.

Starting at the core, and working our way to the heaviest, pushing all the relevant subsystems to their limits:

  • In-house timing syscall benchmarks (including vdso), libMicro
  • Linpack, single and double precision, Streams
  • Various incantations of sysbench (oltp and cpu)
  • iozone, smallfile, spinning disk, ssd and NAND flash
  • netperf on 10g and 40g, SR-IOV (pipework)
  • OpenvSwitch with VXLAN offload-capable NICs
  • Traditional “large” applications, i.e. business analytics
  • Addressing single-host vertical scalability limits by fixing the Linux kernel and fiddling some bits in Docker.
  • Using OpenvSwitch to get past the spanning-tree limitations of # of ports per bridged-interface.

All of these mine-sweeping experiments (lots more to come!) have allowed us to find and fix plenty of issues and document best-practices that we hope will lead to a great customer experience.

BTW if you’re interested in serious, low level, Enterprise-grade performance analysis and tuning for Linux containers (or in general!), let’s have a chat @DockerCon … I’ll be one of the guys in a Project Atomic T-shirt 🙂

Unique Docker Philosophies

  • Ease of use:  Docker automates the use of existing Linux kernel technologies into an easily consumable format.  Setup and administration of traditionally disjoint subsystems (cgroups, namespaces, iptables, selinux) are encapsulated by Docker.
  • Packaging:  Docker specifies an image/packaging format that allows an application to be packaged with it’s full userspace requirements.  No longer is there a necessary interaction between system-level packages (other than the kernel) with the containerized application.  The application sees only what is provided inside the container.  This can be for example, a specific version of gcc or php that differs from what the host OS provides.  I keep drawing an analogy to BIND “views”.

Performance interests aside, those are the 2 main selling points for me, and the benefits of those cannot be overstated.

Surprise, we added some enterprise-y stuff

Docker learns about systemd

Red Hat has taught Docker to use systemd, rather than sysvinit.  I mention this because (depending on who you’re talking to) it may be controversial.  But I believe that the true promise of containers on Linux relies on specific capabilities that systemd provides:  at least init dbus messaging, remote capabilities, cgroups API, remote journaling.

Docker systemd unit-file override:

  • systemd supports “.d”-style overrides for installed unit-files.  This is the correct way to customize the defaults for any systemd unit-file.  Overrides go in /etc/systemd/system/.
  • I need an override for my testing, because I want to use my own bridge device and I want to play with the MTU as well.  By default, Docker creates a bridge called docker0 and assigns IP addresses from that pool, useful for development, not production.  For production, I guess folks will want to set up their own bridge (or pass through a device, macvlan, whatever).
  • Assuming you have a bridge that you want to use, create a new systemd unit override file called /etc/systemd/system/docker.service.  Here is an example where I’ve set Docker to use a bridge named ‘br1’ and I also added ‘-D’  to enable debug logging for the Docker daemon.  br1 is on my test network, on an IP range that I control.  Finally, I’ve bumped the MTU to 9000 for some throughput tests…
ExecStart=/usr/bin/docker -d --selinux-enabled -H fd:// -b br1 -D --mtu=9000

Also Stephen Tweedie spotted unnecessary memory consumption in systemd mount/umount handling, which was fixed in record time by Lennart Poettering 🙂

Docker learns about SELinux

Red Hat has brought SELinux support to Docker.  If you’ve been using Red Hat products for any length of time, you know security is a first order concern for us.  Look at the stats for critical CVE reponse time…adding SELinux support to Docker should come as no surprise 🙂  Shout out to the wizards in Red Hat’s Security Response Team, btw.

After the initial bring-up, SELinux support has been fairly painless for us in the Performance Group.  Dan Walsh is doing a talk called “SELinux and Docker” at DockerCon next week (June 10, 2pm, actually).  To give you a sense of how serious Red Hat is about containers and Docker, I should also mention Red Hat’s CTO Brian Stevens is doing one of the keynotes and we’re Platinum sponsoring.  Here’s the very high level picture:

Red_Hat-Project-Atomic-Introduction

Dockerfile for Performance Analysis

What is a Dockerfile?

Why create a Dockerfile specifically for Performance Analysis?

  • One of the core principals of Docker images is that they are absolutely as small as possible.  This is because when a user wants to use your container image, they must pull it over the network.  Docker hosts a registry at http://index.docker.io.  Folks may stand up their own internal registries as well, where bandwidth is a bit less of a concern, images can contain site-specific customizations, intellectual property, licensed software, etc.
  • Our engineers have been working hard to reduce the base image size.  Therefore, the base images include the smallest usable package set, plus necessary tooling/package management utilities (yum) to pull in anything else the user needs inside their containers.  Think @core on steriods.
  • Because of the size constraints on the base image, we have to layer on our usual set of Performance Analysis tools via Dockerfile rather than kickstart.
  • A very common question I get from the field is to provide a precise list of performance analysis packages/tools that I would recommend in their base RHEL images.  So I put a slide in the Summit deck this year:

helpful_utilities

Example Dockerfile

It’s not all that complicated, but includes lots of helpful utilities for characterizing workloads running inside containers.  You might see that sysstat is missing; that’s because I monitor that information on the host.  This is one critical differentiation between virtualization, and containers:  the VCPUs of a KVM guest exist as processes in the host.  With containers, the actual containerized binary shows up in the process list of the host.  Note:  the PID namespace ensures isolation of process tables between containers.

FROM rhel7:latest
MAINTAINER perf <perf@domain.com>

RUN yum install -q -y bc blktrace btrfs-progs ethtool gcc git gnuplot hwloc iotop iproute iputils less mailx man-db netsniff-ng net-tools numactl numactl-devel openssh-clients openssh-server passwd perf procps-ng psmisc screen strace tcpdump vim-enhanced wget xauth which 

RUN git clone http://whatever/project.git

ENV HOME /root
ENV USER root
WORKDIR /root
EXPOSE 22

You might also notice that I’m installing numactl and hwloc.  That’s because recent versions of Docker provide access to sysfs hardware topology tables from the host, allowing you to apply similar tuning techniques as you would on bare metal on containerized processes.  We had some pretty funny test automation explosions when sysfs hardware topology was not exposed 🙂  Side note, you can’t tune IRQ affinity from a non-privileged container, but luckily IRQ balance really does a great job these days (even knows about PCI-locality).  Privileged containers CAN program IRQ affinity.

CPU and memory affinity is another important differentiation between VMs and containers.   In a container,  core1 is core1 on the host, core2 is core2 etc (depending on your cgroups config).  With VMs you apply specific vcpupin/numatune/emulatorpin commands in order to ensure VCPU threads and their memory utilize specific CPUs/memory banks.  The process of properly applying affinity to KVM guests is well-documented in Red Hat’s Virtualization Tuning and Optimization Guide.  Naturally, when we characterize VMs and containers inside VMs, we often apply much of that.

How to build a container with the Performance Dockerfile

# time docker build --no-cache=true -t r7perf --rm=true - < Dockerfile_r7perf

# docker run -it r7perf bash

root@7d7b16277784: / # exit

How do I add my benchmark/tool/workload to this Docker container?

  • Ideally, a pre-configured set of scripts would be committed to your own git repo, and pulled into this container automatically in the Dockerfile (RUN git clone http:///whatever/project.git).  This is our approach.
  • Add a RUN command to the Dockerfile that uses yum, wget, git or similar to pull in, install and configure your software.
  • Run a container interactively, then pull down the benchmark manually.  This is our fallback for some of the more challenging/complex benchmarks and under-load analysis.

How to get a benchmark running inside a Docker container

Let’s take for example, sysbench.

  • I’ve built RPMs for sysbench for RHEL6 and RHEL7 and committed them to our git repository.  I’ve also committed my driver script called run-sysbench.sh. (this isn’t mandatory, but using git makes things a LOT easier).
    • You can add a RUN statement to the Dockerfile that wget’s your benchmark/tarball from somewhere, or a RUN that does another git clone of some other repository.
    • However you would normally transfer your code to a new machine, you can do the same thing in the Dockerfile.
  • Once the container build is complete, launch a container, and kick off your workload.  run-sysbench.sh could be any driver/wrapper script that you’ve got.
host# docker run -it --privileged r7perf bash

container# yum install -y bench/sysbench/rhel7/*rpm mariadb-server mariadb ; cd bench/sysbench

container# ./run-sysbench.sh oltp docker

...run-sysbench.sh completes and spits out an output/logfile that it copies off the container (rsync, ftp whatever).
  • That’s it.  When the script finishes and you’ve copied off the results (part of run-sysbench.sh), you can ‘exit’ the container.
  • Astute observers will have noticed that I snuck ‘–privileged’ onto the command line above.  That is because my run-sysbench.sh wants to drop_caches, and that’s not something permitted to a container by default.  As an alternative, instead of using privileges, a container could ssh into it’s host machine as root and drop_cache from there.  See Docker source capabilitiesdaemon/execdriver/lxc/init.go for the additional capabilities afforded to “privileged” containers.
  • Fun example:  create 100 containers running apache, in 14 seconds 🙂
# time for i in $(seq 100) ; do docker run -d r7perf /usr/sbin/httpd -DFOREGROUND ; done

43bd1efc8fd4d8cedcced29cedf7176286077661a4df02c27756b3959a9fa75f
de1cc33c8f73d9ebce8676ab52da5e1da9518c649af87688f4a89dbda197c7cb
...

real 0m14.159s
user 0m0.386s
sys 0m0.386s

It’s not very often that a new technology comes up that creates a whole new column for performance characterization.  But containers have done just that, and so it’s been quite the undertaking.  There are still many tests variations to run, but so far we’re encouraged.

That said, I have to keep reminding myself that performance isn’t always the first concern for everyone (*gasp*).  The packaging, development and deployment workflow that breaks the ties between host userspace and container userspace has frankly been a breath of fresh air.

Performance Analysis and Tuning Videos from Red Hat Summit 2014

This year’s Red Hat Summit took place at the Moscone Center in downtown San Francisco.  Red Hat’s Performance Engineering team had it’s opportunity to showcase our contributions to products and customers with presentations on performance tuning for RHEL, databases, and Red Hat Storage (with behind-the-scenes/support data for many other talks).

Summit is always exciting, because as a company, Red Hat finally gets to reveal what we’ve been cooking.  For example, you may have seen Jim Whitehurst  announce during his keynote, a RHEL variant for containers called Red Hat Enterprise Linux Atomic Host via the open source Project Atomic.  Having witnessed the internal development velocity and excitement from customers/partners at Summit around Atomic in particular, I am just so happy for our extremely hard working development teams who are doing everything out in the open, the “Red Hat Way”, as it absolutely should be.

Red Hat made so many announcements, I’d encourage you to look at their Twitter feed to catch it all.

This year marked my 2nd turn as a partner in the Performance Analysis and Tuning presentation.  If you haven’t attended a Summit before, this 2-part session is typically (this year included) one of the most highly anticipated and attended sessions.  Our A/V team has already posted the videos for both parts:  Part 1 and Part 2.

Red Hat also announced the imminent availability of the Red Hat Enterprise Linux 7 Release Candidate.  The RC includes quite a few performance improvements and important fixes (including this one, which I mentioned during one of the perf talks).  To compliment the RC, our docs team has also refreshed the official RHEL7 Documentation, which means I don’t have to keep pointing people to my blog to figure out nohz_full anymore 🙂

If you haven’t tried the RHEL7 beta, I’d strongly encourage you look at the RC when it hits RHN.  It’s also probably best that you do a fresh install.

From helping characterize RHEL7, to OpenStack, Red Hat Storage, OpenShift and Docker, it’s been just an insane few years.   The most fun I’ve had in my career, too.   #opensource rocks!

nohz_full=godmode ?

Starting with some background…What is the kernel timer tick (aka LOC interrupt), and what does it do ?

The kernel timer tick is a interrupt triggered at a periodic interval (based on the kernel compile option CONFIG_HZ). The tick is what keeps track of kernel statistics such as CPU and memory usage and provides for scheduler fairness through it’s load balancer. It also does timekeeping, i.e. to keep gettimeofday updated.

When the tick fires (as often as every millisecond, based on value of CONFIG_NO_HZ), it will get scheduled ahead of whatever’s currently running on a CPU core. In other words, whatever was running (with all of it’s valuable data cache-hot) will be interrupted by the tick. The CPUs L1 instruction and data caches (the smallest yet fastest) are invalidated, somewhere around 1000 times a second (if the task was 100% CPU-bound which the majority are not).

This is not an All Is Lost scenario, but certain workloads might see a 1-3% hit that could be attributed to this interference. It also caused some noticeable jitter, especially since what happens inside the tick is not deterministic. The total time the tick runs is not a predictable/constant value.

That was a mouthful, so let me dissect it a bit by describing various kernel config options that control how often this tick fires.

Prior to the introduction of the “tickless kernel” in kernel 2.6.21, the timer tick ran on every core at the rate of CONFIG_HZ (i.e. 1000/sec). This provided for a decent balance of throughput and latency. It had the side-effect of waking up every core constantly, which wasn’t necessary when nr_running=0 (a per-core attribute…see /proc/sched_debug). The scheduler says there’s nothing to run on the core, so let’s disable the tick there and save some power by not waking the CPU up from a deeper c-state. Actually it saves lots of power; linux has become quite a responsible citizen in this regard.

In summary:

RHEL5 – CONFIG_HZ=1000
- No Tickless support
- Ticks 1000/sec on every CPU no matter what
RHEL6 – CONFIG_HZ=1000, CONFIG_NO_HZ=y
- Tickless when nr_running = 0
- Ticks 1000/sec when nr_running > 0
RHEL7 – CONFIG_HZ=1000, CONFIG_NO_HZ=y, CONFIG_NO_HZ_FULL=y, etc.
- Opt-in support for nohz_full
- Tickless when nr_running <= 1
- Ticks 1000/s when nr_running > 1

Note: for RHEL7, you will need 3.10.0-68 or later.

Red Hat’s Frederic Weisbecker has been working with other industry leaders such as Paul McKenney from IBM (and many others) to implement a feature called Full NO HZ. During the development phase, it has changed names several times (i.e. adaptive tickless). These days the kernel cmdline option to toggle it is nohz_full, so that’s what I’m calling it.

This feature requires yet another slew of kernel config options, along with some userspace gymnastics (that I’ll detail later) to get everything lined up. So far the use-cases for disabling the tick has been embedded applications, HPC/scientific, and the financial guys who need real-time characteristics.

It makes sense then to have these features enabled, but defaulted to OFF such that these folks can opt-in.  As you’ll see it’s not really necessary for everyone, nor do most workloads expose the tick as the “top-talker” in traces. But several can, and it was for those customers that the feature was developed.

nohz_full has the following characteristics:

  • Stop interrupting userspace when nr_running=1 (see /proc/sched_debug).
    • If runqueue depth is 1, then the scheduler should have nothing to do on that core.
  • Move all timekeeping to non-latency-sensitive cores.
  • Mark certain cores as nohz_full cores via cmdline.  In this example, the system has 2 sockets, 8 cores each, 16 cores total, logical cores disabled.  I want to dump everything I can over to core 0, leaving cores 1-15 for my performance critical application:
Kernel cmdline: nohz_full=1-15 isolcpus=1-15 selinux=0 audit=0

# dmesg|grep dyntick
dmesg: [ 0.000000] NO_HZ: Full dynticks CPUs: 1-15.
  • In addition to cmdline options nohz_full, the user must move RCU threads themselves.
 # for i in `pgrep rcu` ; do taskset -pc 0 $i ; done

Frederic has written a small harness that uses kernel tracepoints and the ftrace interface to test and debug during this feature’s development.  It’s available here:

git://git.kernel.org/pub/scm/linux/kernel/git/frederic/dynticks-testing.git

That harness spits out something like this:

root@localhost: ~/dynticks-testing # cat trace.1
 # tracer: nop
 #
 # entries-in-buffer/entries-written: 10392/10392 #P:16
 #
 # _-----=> irqs-off
 # / _----=> need-resched
 # | / _---=> hardirq/softirq
 # || / _--=> preempt-depth
 # ||| / delay
 # TASK-PID CPU# |||| TIMESTAMP FUNCTION
 # | | | |||| | |
 -0 [001] d... 1565.585643: tick_stop: success=yes msg=
 user_loop-10409 [001] d.h. 1565.586320: hrtimer_expire_entry: hrtimer=ffff881fbfa2ec80 function=tick_sched_timer now=1565474000583
 user_loop-10409 [001] d... 1565.586327: tick_stop: success=yes msg=
 user_loop-10409 [001] d.h. 1566.586352: hrtimer_expire_entry: hrtimer=ffff881fbfa2ec80 function=tick_sched_timer now=1566474000281
 user_loop-10409 [001] d.h. 1567.586384: hrtimer_expire_entry: hrtimer=ffff881fbfa2ec80 function=tick_sched_timer now=1567474000282
 user_loop-10409 [001] d.h. 1568.586417: hrtimer_expire_entry: hrtimer=ffff881fbfa2ec80 function=tick_sched_timer now=1568474000280
 user_loop-10409 [001] d.h. 1569.586449: hrtimer_expire_entry: hrtimer=ffff881fbfa2ec80 function=tick_sched_timer now=1569474000280
 user_loop-10409 [001] d.h. 1570.586482: hrtimer_expire_entry: hrtimer=ffff881fbfa2ec80 function=tick_sched_timer now=1570474000275

What we’re looking for is the tick_stop messages, which mean that tick fired.   Note:  There is still one tick per-second in the current upstream code to maintain scheduler stats for load balancing.   The above output is from a system tuned according to the specifics in this blog post.  It was also necessary to configure the system BIOS for low latency.  Individual OEMs typically publish whitepapers on this topic.

I mentioned certain statistical accounting is done inside the tick.  One of those that is user-controllable is vm.stat_interval (which defaults to 1, so once per second).  You will see that even with nohz_full, vm.stat_interval will pop at that interval.  Frederic’s test harness accounts for this by setting vm.stat_interval to 120, then running the test for 10 seconds.  If you run the test for 120+ seconds, you will see vmstat_update fire (and possibly other things like xfs).

kworker/1:0-141 [001] .... 2693.850191: workqueue_execute_start: work struct ffff881fbfa304a0: function vmstat_update

kworker/1:0-141   [001] ....  2713.458820: workqueue_execute_start: work struct ffff881f90e07c28: function xfs_log_worker [xfs]

This feature is a massive improvement in terms of cache efficiency.  To see what I mean, try running this test harness without the kernel cmdline optons 🙂

To get rid of the xfs_log_worker interference, you can use the tunable workqueues feature of the kernel’s bdi-flush writeback threads.  If, as in the above example, you are using core 0 as your “housekeeping CPU”, then you could affine the bdi-flush threads to core 0 like so:

# echo 1 > /sys/bus/workqueue/devices/writeback/cpumask

It takes a hex argument, so 1 is actually core 0.

At this point whenever the kernel wants to write dirty pages, it will wake up these bdi-flush threads as normal, but now they will wake up with the affinity that you programmed in.  Keep in mind that a single core might not be enough to do the writeback and whatever else the kernel needs to do, because bdi-flush threads, like any IO thread, block.  You might need to use 2+ cores.  Keep an eye out for CPU congestion or blocking on the housekeeping core (mpstat or similar).

Also note that by default in RHEL7, bdi-flush threads are NUMA-affined to be PCI-local to your storage adapter (whether it’s a local SCSI/SATA card or HBA).  That’s a change from RHEL6 where bdi-flush threads had no affinity by default.  You can disable the default NUMA affinity and return RHEL6 setting like so:

# echo 0 > /sys/bus/workqueue/devices/writeback/numa

The 2 “echo” commands above do not persist reboots.

Now…If you run turbostat while in this configuration, you will see that the timekeeping core  (core 0 in this case) is kept busy enough (because it is now ticking @ CONFIG_HZ rate) to be kept in C-state 0.  That’s less than palatable, and was later fixed by Paul McKenney and is called CONFIG_NO_HZ_FULL_SYSIDLE.  When that’s set, the timekeeping core is no longer pegged.  Godmode???

Here’s another way to examine the tick’s behavior:

# perf stat -C 1 -e irq_vectors:local_timer_entry sleep 1

9 irq_vectors:local_timer_entry

pig is a program written by my co-worker Bill Gray.  It’s used as an artificial load generator.   Below, it spins on the CPU for 1 second.  Unfortunately it’s not packaged for RHEL.  But you can use this instead, just as well.

So here is the trace without the cmdline options.  You can see that the tick fires roughly 1000 times in the 1 second run, and is expected out of the box behavior.

# perf stat -C 1 -e irq_vectors:local_timer_entry taskset -c 1 /root/pig -s 1

1005 irq_vectors:local_timer_entry

Then reboot with nohz_full=1-15 rcu_nocbs=1-15 and isolate core 1 from userspace tasks and IRQs.  You could do this with isolcpus=1-15 too.

# tuna -c 1 -i ; tuna -q * -c 1 -i

The same pig run ends up with only a handful of interruptions! Oink!

# perf stat -C 1 -e irq_vectors:local_timer_entry taskset -c 1 /root/pig -s 1

4 irq_vectors:local_timer_entry

Here’s yet another (less granular) way to see what’s going on:

# watch -n1 -d "cat /proc/interrupts|egrep 'LOC|CPU'"

Now that you’ve validated your configuration, it’s time to run your applications and see if this feature gives you any boost.  If you’ve got the right NICs, try out the busy polling socket option, too.

Here is some further reading on the topic, including a video of Frederic Weisbecker from LinuxCon where he covers this feature in detail.

https://www.kernel.org/doc/Documentation/timers/NO_HZ.txt
http://lwn.net/Articles/549580/
http://www.youtube.com/watch?v=G3jHP9kNjwc

Oh, did you expect the CPU ?

Sea-change alert…

For a while now, there has been a drive to lower power consumption in the datacenter. It began with virtualization density, continues with linux containers (fun posts coming soon on that), newer processors and their power-sipping variants, CPU frequency governors, CPU idle drivers, and new architectures like ARM and Intel’s Atom.

The sea change I’m alluding to is that with all of this churn in the hardware and kernel space, applications may have not kept up with what’s necessary to achieve top performance. My contact with customers and co-workers has surfaced a very important detail: application developers expect the hardware and kernel to “do the right thing”, and rightfully so. But customer-driven industry trends such as reduced power consumption have a side-effect: reduced performance.

Circling back to the title of this article…again, for a number of years the assumption by developers that full-bore CPU power is available 100% of the time is somewhat mis-leading. After all, when you shell out for those fancy new chips, you get what you pay for, right ? 🙂 The hardware and CPU frequency/idle drivers are biased towards power savings, I personally believe due to industry pressure, in their default configurations. If you’ve read some of my previous posts, you understand the situation, know how to turn all of that off during runtime, and get excellent performance at the price of power consumption.

But there’s got to be some sort of middle-ground…and in fact, our experiments have proven a few options for customers. For example…if you look at the C-state exit latencies on a Sandy Bridge CPU

# find /sys/devices/system/cpu/cpu0/cpuidle | grep latency | xargs cat
0
1
80
104
109

You can see that the latencies increase dramatically, the deeper you go. What if you just cut off the last few ? That turns out to be a valid compromise! You can set /dev/cpu_dma_latency=80 on this system and that will keep you out of the deepest C-states (C6 and C7), that have the highest exit latencies. Your cores will float somewhere between C3 and C0.

This method allows you to benefit from turbo-boost, when there is thermal headroom to do so. And we’ve seen improvements across a wide-variety of workloads that are not CPU-bound. Things like network- and disk-heavy loads that have small pauses (micro/milli) in them that allow the CPU to decide to go into deeper idle states, or slow it’s frequency. Oh by the way, the kernel recently grew tracepoints for PM/QoS subsystem. I think I could summarize this by saying if your workload is IRQ-heavy, you will probably see a benefit here because IRQs are just long enough to keep the processors out of C0. Generally I see a 30-40% C0 residency and the rest in C1 when I have a workload that is IRQ-heavy.

So when you use something like the latency-performance tuned profile that ships in RHEL, amongst other things, you lock the processors in C1 state. That has the side-effect of disabling turbo (see TDP article above), which is generally fine since all the BIOS low latency tuning guides I’ve seen tell you to disable turbo anyway (to reduce jitter). But. And there’s always a but. If you have a low thread count, and you want to capture turbo speeds, there is a new socket option, brought to you by Elizier Tamir from Intel, based on Jesse Brandeburg’s Low Latency Sockets paper from Linux Plumbers Conference 2012. It has since been renamed busy-polling, something I’m having a hard time getting used to myself…but whatever.

The busy-polling socket option is enabled either in the application code through setsockopt SO_BUSY_POLL=N, or sysctl net.core.busy_{read,poll}=N. See Documentation/sysctl/net.txt. When you enable this feature (which btw requires driver enablement…as of this writing, ixgbe, mlx4, bnx2x), the driver will busy-poll the hardware RX queue on the NIC and thus reduce latency. As mentioned in the commit logs for the patch set and the kernel docs, it has the side-effect of increased power consumption.

Starting off, I talked about looking for balance between hardware/idle driver power-savings BIAS, and performance (while retaining as much power savings as we can). The busy-polling feature allows you to (indirectly) lock only those cores active for your application into more performant C-states and operating frequencies. When your socket starts receiving data, the core executing the application owning the socket goes almost immediately to 100% in C0, while all the other cores remain in c6. As I said, without the socket option, only 30-40% of the time is spent in C0. It’s important to note that when the socket is NOT receiving data, the core transitions into a deep c-state. This is an excellent balance of power and performance when you need it.

This allows the cores being used by the application to benefit from turbo speeds, which explains why busy-polling outperforms the low-latency tuned profile (which effectively disables turbo by locking all cores into C0). Not only does this option outperform the c-state lock (because of turbo boost), it also helps achieve a more favorable balance of low latency performance vs power consumption by allowing other cores in the system to go into deep c-states. Nirvana ???

Back to macro: the busy-polling knob is only one way that developers should ask for the CPU these days. The second (and as I’m told under authority), preferred way to instruct the CPU what your application performance tolerances are, is through the /dev/cpu_dma_latency interface. I’ve covered the latter in a previous article, please have a look.

And here’s what I mean:

busy-poll-blog2

Performance Analysis and Tuning Videos from Red Hat Summit 2013

The Performance Engineering group under direction of John Shakshober (aka Shak), had a very busy spring working with our excellent customer and partner ecosystem, generating high-value content for Summit attendees. A great example of collaboration with customers was a super interesting talk from NASA, along with Red Hat’s Mark Wagner and Shak. Hopefully they post a video of it!

On Red Hat’s website, you can find videos of the keynotes as well as many other excellent presentations. Be sure to check them out here. All in all, a great week…very happy to re-connect with customers, partners and fellow Red Hat associates.

One of the recurring (and popular) presentations at Red Hat Summit is the Performance Analysis and Tuning “Shak and Larry Woodman Show”. This year, along with Bill Gray, I was honored to be a small piece of this very well attended talk.

Red Hat’s event A/V staff continues to raise the bar, and has posted videos here: Part 1 and Part 2. I hope they’re helpful!